Amazon RDS 监控集成
Amazon 关系数据库服务(RDS)是一项托管 Web 服务,可让您在云中轻松部署和扩展 SQL 数据存储。借助 Site24x7 的 RDS 集成,您可以监控每个活动关系数据库实例的 CPU 使用率、CPU 点数使用量、突发余额、读/写 IOPS、数据库连接数、网络吞吐量等指标。支持所有 RDS 引擎类型。
设置和配置
RDS 监控的 Performance Insights
Performance Insights 是 AWS 提供的高级工具,可让用户深入了解 RDS 数据库实例的性能,从而帮助诊断性能问题并优化数据库操作。Site24x7 的 RDS Performance Insights 监视器可帮助您实时监控和分析 RDS 实例的性能。
为充分利用 Site24x7 的 RDS 监控功能,请确保在 AWS 管理控制台中启用 Performance Insights。
如需在 AWS 控制台中为 RDS 实例启用 Performance Insights,请执行以下步骤:
- 打开 AWS 管理控制台。
- 导航至 RDS,然后选择数据库。
- 选择您要为其启用 Performance Insights 的实例。
- 单击修改。
- 在监控部分,启用开启 Performance Insights 选项并设置保留期。
- 查看更改,然后单击继续。
- 选择适用的计划修改选项,然后单击修改集群。
Site24x7 将 Performance Insights 监视器作为高级监视器提供。当您集成在 AWS 中已配置 Performance Insights 的 RDS 实例时,Site24x7 会自动为该 RDS 实例创建一个 Performance Insights 监视器。
如需在 Site24x7 中为您的 RDS 实例禁用 Performance Insights 监视器,请执行以下步骤:
- 导航至已监控 RDS 实例的编辑监视器详情页面。
- 将开启 Performance Insights 选项切换为否。
- 单击保存。
策略和权限
请确保分配给 Site24x7 IAM 实体的策略中包含以下只读级别的 API 操作。了解更多。
- "rds:ListTagsForResource",
- "rds:DescribeDBInstances",
- "rds:DescribeDBLogFiles",
- "rds:DescribeAccountAttributes",
- "rds:DescribeDBClusters",
- "rds:DescribeEvents"
- "rds:DescribeDBClusterParameters",
- "rds:DescribePendingMaintenanceActions",
- "rds:DescribeDBClusterEndpoints"
轮询频率
Site24x7 根据设置的轮询频率(1 分钟至 1 天)查询 CloudWatch API,以收集 RDS 资源的性能指标。 了解更多。
IT 自动化
您可以为 Site24x7 支持的 AWS 服务添加自动化。登录 Site24x7,然后转至管理 > IT 自动化模板 (+) > 添加自动化模板。添加自动化后,您可以计划执行这些自动化,使其按顺序依次运行。
请参阅以下主题,了解有关 RDS 操作的更多信息:
- 使用 Amazon RDS 自动化,启动、停止和故障切换重启数据库实例。
- 启动、停止和重启 Amazon RDS 集群。
支持的指标
Amazon RDS 性能指标
| 属性 | 描述 | 统计 | 数据类型 |
|---|---|---|---|
| Bin log disk usage | 衡量二进制日志占用的磁盘空间量。仅适用于 MySQL 只读副本。 | Average | Bytes |
| Buffer cache hit ratio | 衡量由缓冲区缓存处理的请求百分比。 | Average | Percentage |
| Burst balance | 衡量可用 GP2 突发存储桶 I/O 点数的百分比。 | Average | Percentage |
| CPU utilization | 衡量已使用 CPU 的百分比。 | Average | Percentage |
| CPU credit usage | 衡量数据库实例消耗的点数数量。 | Average | Count |
| CPU credit balance | 衡量已累积的已获 CPU 点数数量。 | Average | Count |
| CPU surplus credit balance | 衡量已消耗的超额点数数量。仅适用于 T2 无限实例。 | Average | Count |
| Database connections | 衡量正在使用的数据库连接数。 | Average, sum, maximum | Count |
| Database connections real count | 衡量活动/已打开的连接数。 | Average | Count |
| CPU surplus credits charged | 衡量未被已获 CPU 点数抵扣的已消耗超额点数数量。仅适用于 T2 无限实例。 | Average | Count |
| Disk queue depth | 衡量未完成的 I/O 请求(读/写)数量。 | Average | Count |
| Freeable memory | 衡量可用 RAM 的大小。 | Average | Bytes |
| Free storage space | 衡量可用存储空间的大小。 | Average | Bytes |
| Maximum used transaction IDs | 已使用的最大事务 ID。仅适用于 PostgreSQL。 | Average | Count |
| Network receive throughput | 衡量数据库实例上的入站(接收)网络流量,包括客户流量和 Amazon RDS 流量。 | Average | MB/sec |
| Network transmit throughput | 衡量数据库实例上的出站(传输)网络流量,包括客户流量和 Amazon RDS 流量。 | Average | MB/sec |
| Oldest replication slot lag | 衡量在接收 WAL 数据方面延迟最多的副本的大小。 | Average | Count |
| Read IOPS | 衡量每秒磁盘 I/O 操作次数。 | Average | Count/sec |
| Read latency | 衡量每次磁盘 I/O 操作所需的时间。 | Average | Seconds |
| Read throughput | 衡量每秒从磁盘读取的字节数。 | Average | Bytes/sec |
| Replica lag | 衡量只读副本数据库实例落后于源数据库实例的时间。 | Average | Seconds |
| Swap usage | 衡量已使用的交换空间大小。 | Average | Bytes |
| Transaction logs disk usage | 衡量事务日志占用的磁盘空间。仅适用于 PostgreSQL。 | Average | MB |
| Transaction logs generation | 衡量每秒生成的事务日志大小。仅适用于 PostgreSQL。 | Average | Count |
| Write IOPS | 衡量磁盘 I/O 操作的平均次数。 | Average | Count/sec |
| Write latency | 衡量每次磁盘 I/O 操作的平均时间。 | Average | Seconds |
| Write throughput | 衡量每秒写入磁盘的平均字节数。 | Average | Bytes/sec |
| EBS IO balance percentage | RDS 数据库突发存储桶中剩余 I/O 点数的百分比。 | Average | Percentage |
| EBS byte balance percentage | RDS 数据库突发存储桶中剩余吞吐量点数的百分比。 | Average | Percentage |
| Maximum used storage percentage | 已使用存储量占总分配存储量的百分比。 | Average | Percentage |
| Memory Utilization | RDS 实例中已使用总内存的百分比。 | Average | Percentage |
Amazon Aurora 指标
| 属性 | 描述 | 统计 | 数据类型 |
|---|---|---|---|
| Active transactions | 衡量 Aurora 数据库实例上当前正在执行的事务数。 | Sum | Count |
| Aurora Binlog replica lag | 衡量使用 MySQL 在 Aurora 上运行的副本数据库集群落后于源数据库集群的时间。 | Average | Milliseonds |
| Aurora replica lag | 衡量复制更新时的延迟量。 | Average | Millisecond |
| Aurora replica lag maximum | 衡量主实例与每个 Aurora 数据库实例之间的最大延迟量。 | Average | Milliseconds |
| Aurora replica lag minimum | 衡量主实例与每个 Aurora 数据库实例之间的最小延迟量。 | Average | Milliseconds |
| Blocked transactions | 衡量被阻塞的事务数。 | Sum | Count |
| Commit latency | 衡量提交操作的延迟。 | Average | Milliseconds |
| Commit throughput | 衡量每秒提交操作的次数。 | Average | Count per second |
| DDL latency | 衡量数据定义语言(DDL)请求的延迟。 | Sum | Milliseconds |
| DDL throughput | 衡量 DDL 请求的数量。 | Sum | Count per second |
| Deadlocks | 衡量数据库中的死锁数。 | Sum | Count |
| Delete latency | 衡量 DELETE 查询的延迟。 | Average | Milliseconds |
| Delete throughput | 衡量每秒 DELETE 查询的数量。 | Average | Count per second |
| DML latency | 衡量插入、更新和删除操作的延迟量。 | Average | Milliseconds |
| DML throughput | 衡量插入、更新和删除操作的平均次数。 | Average | Count per second |
| Engine uptime | 衡量实例已运行的时间。 | Average | Seconds |
| Free local storage | 衡量可用于临时表和日志的存储空间大小。 | Average | MB |
| Insert latency | 衡量 INSERT 查询的延迟量。 | Average | Milliseconds |
| Insert throughput | 衡量 INSERT 查询的平均数量。 | Average | Count per second |
| Login failures | 衡量登录失败尝试的次数。 | Sum | Count |
| Network throughput | 衡量每个实例与客户端之间接收和发送的字节总量。 | Average | Count per second |
| Queries | 衡量已执行的查询数量。 | Average | Count per second |
| Result set cache hit ratio | 衡量由结果集缓存处理的请求数量。 | Average | Percentage |
| Select latency | 衡量 SELECT 查询的延迟量。 | Average | Milliseconds |
| Select throughput | 衡量 SELECT 查询的平均数量。 | Average | Count per second |
| Update latency | 衡量 UPDATE 查询的延迟量。 | Average | Milliseconds |
| Update throughput | 衡量 UPDATE 查询的平均数量。 | Average | Count per second |
| Volume bytes used | 衡量您的 Aurora 数据库实例使用的存储量。 | Average | MB |
| Volume read IOPs | 衡量集群卷上计费的读取 I/O 操作次数。 | Sum | Count |
| Volume write IOPs | 衡量集群卷上计费的写入 I/O 操作次数。 | Sum | Count |
| Serverless database capacity | 衡量 Serverless Aurora 数据库实例的容量。 | Average | Count |
| Total backup storage billed | 已计费备份存储的总量。 | Maximum | GB, Bytes |
| Snapshot storage used | 衡量快照占用的已计费备份存储量。 | Maximum | GB, Bytes |
| Backup retention period storage used | 衡量在备份保留窗口内支持时间点恢复功能所使用的已计费备份存储量。 | Maximum | GB, Bytes |
| Backtrack change records creation rate | 衡量随时间创建的回溯更改记录数量。 | Average | Count |
| Backtrack change records stored | 衡量实际的回溯更改记录数量。 | Average | Count |
| Backtrack window actual | 衡量目标回溯窗口与实际回溯窗口之间的差值。 | Average | Minutes |
| Backtrack window alert | 衡量实际回溯窗口小于目标回溯窗口的次数。 | Average | Count |
| Rollback segment history list length | 记录了包含标记为删除记录的已提交事务的撤销日志。这些记录将由 InnoDB 清除操作处理。 | Maximum | Count |
| Row lock time | 获取 InnoDB 表行锁所花费的总时间。 | Average | Milliseconds |
| Aurora DML Rejected Writer Full | 因写入实例已满而被拒绝的数据操作语言(DML)请求数量。 | Average | Count |
| Aurora Estimated Shared Memory Bytes | Aurora 数据库实例使用的估计共享内存大小(字节)。 | Average | Bytes |
| Aurora Slow Connection Handle Count | 慢速连接句柄的数量,即建立时间较长的连接数。 | Average | Count |
| Aurora Slow Handshake Count | 慢速握手的数量,即完成时间较长的初始连接尝试次数。 | Average | Count |
| Aurora Volume Bytes Left Total | 卷上剩余可用于存储的字节总数。 | Average | Bytes |
| Connection Attempts | 尝试建立 Aurora 数据库实例连接的次数。 | Average | Count |
| NumBinary Log Files | Aurora 数据库实例当前使用的二进制日志文件数量。 | Average | Count |
| Storage Network Receive Throughput | 存储层接收数据的网络吞吐量。 | Average | Bytes/Second |
| Storage Network Throughput | 存储层的总体网络吞吐量。 | Average | Bytes/Second |
| Storage Network Transmit Throughput | 存储层传输数据的网络吞吐量。 | Average | Bytes/Second |
| SumBinary Log Size | 当前使用的所有二进制日志文件的总大小。 | Average | Bytes |
| Total IOPS | Aurora 数据库实例的每秒输入/输出操作总次数(IOPS)。 | Average | Count |
| Aborted Clients | Aurora 数据库实例中中止的客户端连接数。 | Average | Count |
| ACU Utilization | Aurora 容量单位(ACU)的使用率,代表已使用的计算和内存资源量。 | Average | Percentage |
| Temp Storage IOPS | Aurora 数据库实例使用的临时存储的 IOPS 数量。 | Average | Count |
| Temp Storage Throughput | Aurora 数据库实例使用的临时存储的吞吐量。 | Average | Bytes/Second |
Amazon Aurora 并行查询指标
| 属性 | 描述 | 统计 | 数据类型 |
|---|---|---|---|
| Aurora Pq Request Attempted | 尝试执行 Aurora 并行查询(PQ)请求的总次数。 | Average | Count |
| Aurora Pq Request Failed | 执行失败的 Aurora PQ 请求总数。 | Average | Count |
| Aurora Pq Request In Progress | 当前正在处理或等待完成的 Aurora PQ 请求数量。 | Average | Count |
| Aurora Pq Request Executed | 已成功执行的 Aurora PQ 请求总数。 | Average | Count |
| Aurora Pq Request Not Chosen | 由于查询复杂性或系统限制等各种原因未被选中执行的 Aurora PQ 请求数量。 | Average | Count |
| Aurora Pq Request Not Chosen Below Min Rows | 因涉及行数低于指定最小阈值而未被选中的 Aurora PQ 请求数量。 | Average | Count |
| Aurora Pq Request Not Chosen Column Bit | 因列包含 BIT 数据类型而未被选中的 Aurora PQ 请求数量。 | Average | Count |
| Aurora Pq Request Not Chosen Column Geometry | 因列包含 GEOMETRY 数据类型而未被选中的 Aurora PQ 请求数量。 | Average | Count |
| Aurora Pq Request Not Chosen Column Lob | 因涉及大对象(LOB)列而未被选中的 Aurora PQ 请求数量。 | Average | Count |
| Aurora Pq Request Not Chosen Column Virtual | 因列包含虚拟属性而未被选中的 Aurora PQ 请求数量。 | Average | Count |
| Aurora Pq Request Not Chosen Few Pages Outside Buffer Pool | 因仅访问缓冲池外少量页面而未被选中的 Aurora PQ 请求数量。 | Average | Count |
| Aurora Pq Request Not Chosen Full Text Index | 因依赖全文索引而未被选中的 Aurora PQ 请求数量。 | Average | Count |
| Aurora Pq Request Not Chosen High Buffer Pool Pct | 因涉及较高比例的缓冲池而未被选中的 Aurora PQ 请求数量。 | Average | Count |
| Aurora Pq Request Not Chosen Index Hint | 因使用索引提示而未被选中的 Aurora PQ 请求数量。 | Average | Count |
| Aurora Pq Request Not Chosen Innodb Table Format | 因 InnoDB 表格式限制而未被选中的 Aurora PQ 请求数量。 | Average | Count |
| Aurora Pq Request Not Chosen Instant Ddl | 因即时数据定义语言(DDL)操作而未被选中的 Aurora PQ 请求数量。 | Average | Count |
| Aurora Pq Request Not Chosen Long Trx | 因存在长时间运行的事务而未被选中的 Aurora PQ 请求数量。 | Average | Count |
| Aurora Pq Request Not Chosen NoWhere Clause | 因缺少 WHERE 子句而未被选中的 Aurora PQ 请求数量。 | Average | Count |
| AuroraPq RequestNotChosenRangeScan | 因范围扫描限制而未被选中的 Aurora PQ 请求数量。 | Average | Count |
| Aurora Pq Request Not Chosen Row Length Too Long | 因行长度超过系统定义限制而未被选中的 Aurora PQ 请求数量。 | Average | Count |
| Aurora Pq Request Not Chosen Small Table | 因涉及小表而未被选中的 Aurora PQ 请求数量。 | Average | Count |
| Aurora Pq Request Not Chosen Temporary Table | 因使用临时表而未被选中的 Aurora PQ 请求数量。 | Average | Count |
| Aurora Pq Request Not Chosen Tx Isolation | 因事务隔离级别限制而未被选中的 Aurora PQ 请求数量。 | Average | Count |
| Aurora Pq Request Not Chosen Unsupported Access | 因不支持的访问方法而未被选中的 Aurora PQ 请求数量。 | Average | Count |
| Aurora Pq Request Not Chosen Unsupported Storage Type | 因不支持的存储类型而未被选中的 Aurora PQ 请求数量。 | Average | Count |
| Aurora Pq Request Not Chosen Update Delete Stmts | 因使用 UPDATE 或 DELETE 语句而未被选中的 Aurora PQ 请求数量。 | Average | Count |
| Aurora Pq Request Throttled Supported Amazon Aurora Forwarding Replica metrics | 因系统资源限制或配置的限制而被限流的 Aurora PQ 请求数量。 | Average | Count |
Amazon Aurora 转发副本指标
| 属性 | 描述 | 统计 | 数据类型 |
|---|---|---|---|
| Forwarding Replica DML Latency | Aurora 中转发副本上数据操作语言(DML)操作(如 INSERT、UPDATE、DELETE)的延迟(响应时间)。 | Average | Milliseconds (ms) |
| Forwarding Replica DML Throughput | Aurora 中转发副本处理的数据操作语言(DML)操作(如 INSERT、UPDATE、DELETE)速率。 | Average | Milliseconds (ms) |
| Forwarding Replica Open Sessions | Aurora 中转发副本当前打开的会话(连接)数量。 | Average | Count |
| Forwarding Replica Read Wait Latency | Aurora 中等待从转发副本获取数据的读取操作的延迟(响应时间)。 | Average | Milliseconds (ms) |
| Forwarding Replica Read Wait Throughput | Aurora 中等待从转发副本获取数据的读取操作速率。 | Average | Count/second |
| Forwarding Replica Select Latency | Aurora 中转发副本上执行 SELECT 查询的延迟(响应时间)。 | Average | Milliseconds (ms) |
| Forwarding Replica Select Throughput | Aurora 中转发副本上执行 SELECT 查询的速率。 | Average | Count/second |
| Forwarding Writer DML Latency | Aurora 中转发写入节点上数据操作语言(DML)操作(如 INSERT、UPDATE、DELETE)的延迟(响应时间)。 | Average | Milliseconds (ms) |
| Forwarding Writer DML Throughput | Aurora 中转发写入节点处理的数据操作语言(DML)操作(如 INSERT、UPDATE、DELETE)速率。 | Average | Count/second |
| Forwarding Writer Open Sessions |
转发写入实例上当前打开的活动数据库连接(会话)数量。 转发写入器负责处理写入操作并将其转发给主实例,从而帮助分担部分写入负载。 |
Average | Count |
RDS 集群
Site24x7 与 Amazon RDS 集群的集成支持以下指标:
除上述指标外,还支持以下 RDS 集群指标:| 指标名称 | 描述 | 统计 | 单位 |
|---|---|---|---|
| Aurora Global DB DataTransfer Bytes | 主 AWS 区域与辅助 AWS 区域之间传输的数据量。 | Sum | Bytes |
| Aurora Global DB Progress Lag | 主节点更新应用到辅助节点所需的时间。 | Maximum | Milliseconds |
| Aurora Global DB Replicated Write IO | 从主集群复制到辅助集群的写入操作次数。 | Sum | Count |
| Aurora Global DB Replication Lag | 主集群写入与其复制到辅助集群之间的延迟。 | Maximum | Milliseconds |
| Aurora Global DB RPO Lag | 主节点最新事务与已安全复制内容之间的时间差。 | Maximum | Milliseconds |
| Aurora Memory Health State | 集群报告的当前内存健康状态。 | Maximum | Gauge |
| Aurora DML Rejected Master Full | 因主实例达到限制而被拒绝的 DML 语句数量。 | Average | Count |
| Aurora Memory Number of Declined Sql Queries Total | 因内存不足而被拒绝的 SQL 查询总数。 | Sum | Count |
| Aurora Memory Number of Killed Connection Total | 因内存不足而被终止的连接总数。 | Sum | Count |
| Aurora Memory Number of Killed Queries Total | 因可用内存不足无法运行而被停止的查询总数。 | Sum | Count |
| Aurora Milliseconds Spent in OOM Recovery | 从内存不足状态中恢复所花费的时间。 | Maximum | Milliseconds |
| Aurora Number of Successful OOM Recovery | 成功从内存不足(OOM)状态恢复的次数。 | Average | Count |
| Aurora Number of Triggered OOM Recovery | 系统进入内存不足恢复状态的次数。 | Average | Count |
| Aurora Optimized Reads Cache Hit Ratio | 从优化读取缓存中提供的读取请求所占的百分比。 | Average | Percentage |
| Write Throughput Ephemeral Storage | 数据写入临时存储的速率。 | Average | Bytes per second |
| Purge Boundary | 标记已存储数据清除边界的当前值。 | Average | Count |
| Purge Finished Point | 数据清除已完成的点。 | Average | Count |
| Read IOPS Ephemeral Storage | 每秒对临时存储的读取操作次数。 | Average | Count per second |
| Read Latency Ephemeral Storage | 完成临时存储读取操作所需的时间。 | Average | Seconds |
| Read Throughput Ephemeral Storage | 从临时存储读取数据的速率。 | Average | Bytes per second |
| Transaction Age Maximum | 最旧活动事务的时长。 | Maximum | Seconds |
| Truncate Finished Point | 截断已完成的最高点。 | Maximum | Count |
| Write IOPS Ephemeral Storage | 每秒对临时存储的写入操作次数。 | Average | Count per second |
| Write Latency Ephemeral Storage | 完成临时存储写入操作所需的时间。 | Average | Seconds |
| Free Ephemeral Storage | 可用的未使用临时存储量。 | Average | Bytes |
| RDS to Aurora Postgre SQL Replica Lag | RDS 主节点更新与其复制到 Aurora PostgreSQL 之间的延迟。 | Average | Seconds |
| CPU Utilization | 衡量已使用 CPU 的百分比。 | Minimum, Maximum, and Average | Percentage |
| Database Connections | 衡量正在使用的数据库连接数。 | Minimum, Maximum, and Average | Count |
| Freeable Memory | 衡量可用 RAM 的大小。 | Minimum, Maximum, and Average | Bytes |
| Serverless Database Capacity | 衡量 Serverless Aurora 数据库实例的容量。 | Minimum, Maximum, and Average | Count |
支持的 RDS Performance Insights 指标
OS General
| 指标名称 | 描述 | 统计 | 单位 |
|---|---|---|---|
| OS General Num VCPUs | 为数据库实例配置的虚拟 CPU 数量。 | Average | Count |
| OS General ACU Utilization | 数据库实例的平均 Aurora 容量单位(ACU)使用率。 | Average | Percentage |
| OS General Max Configured ACU | 为数据库实例配置的最大 Aurora 容量单位(ACU)。 | Average | Percentage |
| OS General Min Configured ACU | 为数据库实例配置的最小 Aurora 容量单位(ACU)。 | Average | Percentage |
| OS General Serverless Database Capacity | 无服务器数据库实例使用的容量。 | Average | Percentage |
OS CPU 使用率
| 指标名称 | 描述 | 统计 | 单位 |
|---|---|---|---|
| CPU Utilization Guest Time | 在 Hypervisor 下运行虚拟处理器所花费的 CPU 时间。 | Average | Percentage |
| CPU Utilization Idle Time | CPU 未积极处理任何任务时的 CPU 时间。 | Average | Percentage |
| CPU Utilization IRQ Time | 处理中断所花费的 CPU 时间。 | Average | Percentage |
| CPU Utilization Nice Time | 用于低优先级(nice)用户进程的 CPU 时间。 | Average | Percentage |
| CPU Utilization Steal Time | Hypervisor 为其他虚拟机从该实例中窃取的 CPU 时间。 | Average | Percentage |
| CPU Utilization System Time | 用于系统(内核)进程的 CPU 时间。 | Average | Percentage |
| CPU Utilization Total | 所有 CPU 的总 CPU 使用率。 | Average | Percentage |
| CPU Utilization User Time | 用于用户级进程的 CPU 时间。 | Average | Percentage |
| CPU Utilization I/O Wait Time | 等待 I/O 操作完成所花费的 CPU 时间。 | Average | Percentage |
| CPU Utilization Kernel Time | CPU 运行内核所占时间的百分比。 | Average | Percentage |
OS 磁盘 IO
| 指标名称 | 描述 | 统计 | 单位 |
|---|---|---|---|
| Aurora Storage Bytes Received | Aurora 存储从实例接收的字节数。 | Average | Bytes |
| Aurora Storage Bytes Transmitted | Aurora 存储传输到实例的字节数。 | Average | Bytes |
| Aurora Storage Disk Queue Depth | Aurora 存储磁盘队列的长度。 | Average | Count |
| Aurora Storage Read IOPS | Aurora 存储上每秒读取 I/O 操作次数。 | Average | Seconds |
| Aurora Storage Read Latency | Aurora 存储上读取操作的延迟。 | Average | Milliseconds |
| Aurora Storage Read Throughput | Aurora 存储上读取操作的吞吐量。 | Average | Bytes |
| Aurora Storage Write IOPS | Aurora 存储上每秒写入 I/O 操作次数。 | Average | Seconds |
| Aurora Storage Write Latency | Aurora 存储上写入操作的延迟。 | Average | Milliseconds |
| Aurora Storage Write Throughput | Aurora 存储上写入操作的吞吐量。 | Average | Bytes |
| RDS Temp Disk I/O Average Queue Length | RDS 临时存储的平均队列长度。 | Average | Count |
| RDS Temp Disk I/O Average Request Size | RDS 临时存储的平均请求大小。 | Average | KB |
| RDS Temp Disk I/O Average Wait Time | RDS 临时存储 I/O 操作的平均等待时间。 | Average | Milliseconds |
| RDS Temp Disk Read IOPS | RDS 临时存储上每秒读取 I/O 操作次数。 | Average | Seconds |
| RDS Temp Disk I/O Read KB | 从 RDS 临时存储读取的千字节数。 | Average | KB |
| RDS Temp Disk I/O Read KBps | 从 RDS 临时存储每秒读取的千字节数。 | Average | KB |
| RDS Temp Disk I/O Read Requests Merged Seconds | RDS 临时存储中每秒合并的读取请求数。 | Average | Seconds |
| RDS Temp Disk Transactions Seconds | RDS 临时存储中每秒事务数。 | Average | Seconds |
| RDS Temp Disk Utilization | RDS 临时存储的使用率百分比。 | Average | Percentage |
| rdstemp.writeIOsPS | RDS 临时存储上每秒写入 I/O 操作次数。 | Average | Seconds |
| RDS Temp Disk Write IOPS | 写入 RDS 临时存储的千字节数。 | Average | Seconds |
| RDS Temp Disk I/O Write KB | 每秒写入 RDS 临时存储的千字节数。 | Average | Seconds |
| RDS Temp Disk I/O Write KBps | RDS 临时存储中每秒合并的写入请求数。 | Average | Seconds |
| Filesystem Disk I/O Average Queue Length | 文件系统存储的平均队列长度。 | Average | Count |
| Filesystem Disk I/O Average Request Size | 文件系统存储的平均请求大小。 | Average | KB |
| Filesystem Disk I/O Average Wait Time | 文件系统存储 I/O 操作的平均等待时间。 | Average | Milliseconds |
| Filesystem Disk Read IOPS | 文件系统存储上每秒读取 I/O 操作次数。 | Average | Seconds |
| Filesystem Disk I/O Read KB | 从文件系统存储读取的千字节数。 | Average | KB |
| Filesystem Disk I/O Read KBps | 从文件系统存储每秒读取的千字节数。 | Average | KB |
| Filesystem Disk I/O Read Requests Merged Seconds | 文件系统存储中每秒合并的读取请求数。 | Average | Seconds |
| Filesystem Disk Transactions Seconds | 文件系统存储中每秒事务数。 | Average | Seconds |
| Filesystem Utilization | 文件系统存储的使用率百分比。 | Average | Percentage |
| Filesystem Disk Write IOPS | 文件系统存储上每秒写入 I/O 操作次数。 | Average | Seconds |
| Filesystem Disk I/O Write KB | 写入文件系统存储的千字节数。 | Average | Seconds |
| Filesystem Disk I/O Write KBps | 每秒写入文件系统存储的千字节数。 | Average | Seconds |
| Filesystem Disk I/O Write Requests Merged Seconds | 文件系统存储中每秒合并的写入请求数。 | Average | Seconds |
| OS Diskio Nvme Avgqueue len (2N1) | NVMe 设备 nvme2n1 的平均队列长度。 | Average | Count |
| NVMe Disk I/O Average Request Size (2N1) | NVMe 设备 nvme2n1 的平均请求大小。 | Average | KB |
| OS Diskio Nvme Await (2N1) | NVMe 设备 nvme2n1 上 I/O 操作的平均等待时间。 | Average | Milliseocnds |
| OS Diskio Nvme Readi osps (2N1) | NVMe 设备 nvme2n1 上每秒读取 I/O 操作次数。 | Average | Seconds |
| NVMe Disk I/O Read KB (2N1) | 从 NVMe 设备 nvme2n1 读取的千字节数。 | Average | KB |
| NVMe Disk I/O Read KBps (2N1) | 从 NVMe 设备 nvme2n1 每秒读取的千字节数。 | Average | KB |
| NVMe Disk I/O Read Requests Merged Seconds (2N1) | NVMe 设备 nvme2n1 上每秒合并的读取请求数。 | Average | Seconds |
| NVMe Disk Transactions Seconds (2N1) | NVMe 设备 nvme2n1 上每秒事务数。 | Average | Seconds |
| NVMe Disk Utilization (2N1) | NVMe 设备 nvme2n1 的使用率百分比。 | Average | Percentage |
| NVMe Disk Write IOPS (2N1) | NVMe 设备 nvme2n1 上每秒写入 I/O 操作次数。 | Average | Seconds |
| NVMe Disk I/O Write KB (2N1) | 写入 NVMe 设备 nvme2n1 的千字节数。 | Average | Seconds |
| NVMe Disk I/O Write KBps (2N1) | 每秒写入 NVMe 设备 nvme2n1 的千字节数。 | Average | Seconds |
| NVMe Disk I/O Write Requests Merged Seconds (2N1) | NVMe 设备 nvme2n1 上每秒合并的写入请求数。 | Average | Seconds |
| rdsdev.avgQueueLen | RDS 设备存储的平均队列长度。 | Average | Count |
| RDS Device Disk I/O Average Queue Length | RDS 设备存储的平均请求大小。 | Average | KB |
| RDS Device Disk I/O Average Request Size | RDS 设备存储 I/O 操作的平均等待时间。 | Average | Milliseocnds |
| RDS Device Disk I/O Average Wait Time | RDS 设备存储上每秒读取 I/O 操作次数。 | Average | Seconds |
| RDS Device Read IOPS | 从 RDS 设备存储读取的千字节数。 | Average | KB |
| RDS Device Disk I/O Read KB | 从 RDS 设备存储每秒读取的千字节数。 | Average | KB |
| RDS Device Disk I/O Read KBps | RDS 设备存储上每秒合并的读取请求数。 | Average | Seconds |
| RDS Device Transactions Seconds | RDS 设备存储上每秒事务数。 | Average | Seconds |
| RDS Device Disk Utilization | RDS 设备存储的使用率百分比。 | Average | Percentage |
| RDS Device Write IOPS | RDS 设备存储上每秒写入 I/O 操作次数。 | Average | Seconds |
| RDS Device Disk I/O Write KB | 写入 RDS 设备存储的千字节数。 | Average | Seconds |
| RDS Device Disk I/O Write KBps | 每秒写入 RDS 设备存储的千字节数。 | Average | Seconds |
| RDS Device Disk I/O Write Requests Merged Seconds | RDS 设备存储上每秒合并的写入请求数。 | Average | Seconds |
| OS Diskio Nvme Avgqueue len (1N1) | NVMe 设备 nvme1n1 的平均队列长度。 | Average | Count |
| NVMe Disk I/O Average Request Size (1N1) | NVMe 设备 nvme1n1 的平均请求大小。 | Average | KB |
| NVMe 1N1 Disk I/O Average Wait Time (1N1) | NVMe 设备 nvme1n1 上 I/O 操作的平均等待时间。 | Average | Milliseocnds |
| OS Diskio Nvme Read iosps (1N1) | NVMe 设备 nvme1n1 上每秒读取 I/O 操作次数。 | Average | Seconds |
| Os Diskio Nvme Readkb (1N1) | 从 NVMe 设备 nvme1n1 读取的千字节数。 | Average | KB |
| NVMe Disk I/O Read KBps (1N1) | 从 NVMe 设备 nvme1n1 每秒读取的千字节数。 | Average | KB |
| NVMe Disk I/O Read Requests Merged Seconds (1N1) | NVMe 设备 nvme1n1 上每秒合并的读取请求数。 | Average | Seconds |
| NVMe Disk Transactions Seconds (1N1) | NVMe 设备 nvme1n1 上每秒事务数。 | Average | Seconds |
| NVMe Disk Utilization (1N1) | NVMe 设备 nvme1n1 的使用率百分比。 | Average | Percentage |
| NVMe Disk Write IOPS (1N1) | NVMe 设备 nvme1n1 上每秒写入 I/O 操作次数。 | Average | Seconds |
| NVMe Disk I/O Write KB (1N1) | 写入 NVMe 设备 nvme1n1 的千字节数。 | Average | Seconds |
| NVMe Disk I/O Write KBps (1N1) | 每秒写入 NVMe 设备 nvme1n1 的千字节数。 | Average | Seconds |
| NVMe Disk I/O Write Requests Merged Seconds (1N1) | NVMe 设备 nvme1n1 上每秒合并的写入请求数。 | Average | Seconds |
| Average Queue Length (4N1)) | NVMe 设备 nvme4n1 的平均队列长度。 | Average | Count |
| NVMe Disk I/O Average Request Size (4N1) | NVMe 设备 nvme4n1 的平均请求大小。 | Average | KB |
| OS Diskio Nvme Await (4N1) | NVMe 设备 nvme4n1 上 I/O 操作的平均等待时间。 | Average | Milliseconds |
| NVMe Disk I/O Read IOPS (4N1) | NVMe 设备 nvme4n1 上每秒读取 I/O 操作次数。 | Average | Seconds |
| NVMe Disk I/O Read KB (4N1) | 从 NVMe 设备 nvme4n1 读取的千字节数。 | Average | KB |
| NVMe Disk I/O Read KBps (4N1) | 从 NVMe 设备 nvme4n1 每秒读取的千字节数。 | Average | KB |
| NVMe Disk I/O Read Requests Merged Seconds (4N1) | NVMe 设备 nvme4n1 上每秒合并的读取请求数。 | Average | Seconds |
| NVMe Disk Transactions Seconds (4N1) | NVMe 设备 nvme4n1 上每秒事务数。 | Average | Seconds |
| NVMe Disk Utilization (4N1) | NVMe 设备 nvme4n1 的使用率百分比。 | Average | Percentage |
| NVMe Disk Write IOPS(4N1) | NVMe 设备 nvme4n1 上每秒写入 I/O 操作次数。 | Average | Seconds |
| NVMe Disk I/O Write KB (4N1) | 写入 NVMe 设备 nvme4n1 的千字节数。 | Average | Seconds |
| NVMe Disk I/O Write KBps (4N1) | 每秒写入 NVMe 设备 nvme4n1 的千字节数。 | Average | Seconds |
| NVMe Disk I/O Write Requests Merged Seconds (4N1) | NVMe 设备 nvme4n1 上每秒合并的写入请求数。 | Average | Seconds |
| NVMe Disk I/O Average Queue Length (5N1) | NVMe 设备 nvme5n1 的平均队列长度。 | Average | Count |
| NVMe Disk I/O Average Request Size (5N1) | NVMe 设备 nvme5n1 的平均请求大小。 | Average | KB |
| OS Diskio Nvme Await (5N1) | NVMe 设备 nvme5n1 上 I/O 操作的平均等待时间。 | Average | Milliseconds |
| NVMe Disk I/O Read IOPS (5N1) | NVMe 设备 nvme5n1 上每秒读取 I/O 操作次数。 | Average | Seconds |
| NVMe Disk I/O Read KB (5N1) | 从 NVMe 设备 nvme5n1 读取的千字节数。 | Average | KB |
| NVMe Disk I/O Read KBps (5N1) | 从 NVMe 设备 nvme5n1 每秒读取的千字节数。 | Average | KB |
| NVMe Disk I/O Read Requests Merged Seconds(5N1) | NVMe 设备 nvme5n1 上每秒合并的读取请求数。 | Average | Seconds |
| NVMe Disk Transactions Seconds(5N1) | NVMe 设备 nvme5n1 上每秒事务数。 | Average | Seconds |
| NVMe Disk Utilization(5N1) | NVMe 设备 nvme5n1 的使用率百分比。 | Average | Percentage |
| NVMe Disk Write IOPS (5N1) | NVMe 设备 nvme5n1 上每秒写入 I/O 操作次数。 | Average | Seconds |
| NVMe Disk I/O Write KB (5N1) | 写入 NVMe 设备 nvme5n1 的千字节数。 | Average | Seconds |
| NVMe Disk I/O Write KBps (5N1) | 每秒写入 NVMe 设备 nvme5n1 的千字节数。 | Average | Seconds |
| NVMe Disk I/O Write Requests Merged Seconds (5N1) | NVMe 设备 nvme5n1 上每秒合并的写入请求数。 | Average | Seconds |
OS 文件系统
| 指标名称 | 描述 | 统计 | 单位 |
|---|---|---|---|
| Filesystem Maximum Files | 文件系统中可存储的最大文件数。 | Average | Count |
| Filesystem Total Space | 文件系统的总存储容量。 | Average | KB |
| Filesystem Used Space | 文件系统中已使用的存储量。 | Average | KB |
| Filesystem Used File Percent | 文件系统中已使用文件存储的百分比。 | Average | Percentage |
| Filesystem Used Files | 文件系统中当前正在使用的文件数。 | Average | Count |
| Filesystem Used Percent | 已使用的文件系统总存储量百分比。 | Average | Percentage |
OS 负载平均(分钟)
| 指标名称 | 描述 | 统计 | 单位 |
|---|---|---|---|
| Load Average (15 Minutes) | 过去 15 分钟的系统平均负载。 | Average | Count |
| Load Average (5 Minutes) | 过去 5 分钟的系统平均负载。 | Average | Count |
| Load Average (1 Minute) | 过去 1 分钟的系统平均负载。 | Average | Count |
OS 内存
| 指标名称 | 描述 | 统计 | 单位 |
|---|---|---|---|
| Active Memory | 正在使用的活动内存量。 | Average | KB |
| Memory Buffers | 缓冲区使用的内存量。 | Average | KB |
| Cached Memory | 已缓存的内存量。 | Average | KB |
| Database Cache Memory | 数据库缓存使用的内存量。 | Average | Bytes |
| Database Resident Set Size | 数据库常驻集大小对应的内存量。 | Average | Bytes |
| Database Swap Memory | 数据库换出的内存量。 | Average | Bytes |
| Dirty Memory | 脏内存的数量。 | Average | KB |
| Free Memory | 可用空闲内存量。 | Average | KB |
| Free Huge Pages | 空闲大页的数量。 | Average | Count |
| Reserved Huge Pages | 预留大页的数量。 | Average | Count |
| Huge Pages Size | 大页的大小。 | Average | KB |
| Huge Pages Surplus | 多余大页的数量。 | Average | Count |
| Total Huge Pages | 大页的总数量。 | Average | Count |
| Inactive Memory | 非活动内存的数量。 | Average | KB |
| Mapped Memory | 已映射内存的数量。 | Average | KB |
| Out of Memory Kill Count | 内存不足终止事件的次数。 | Average | Count |
| Page Tables Memory | 页表使用的内存量。 | Average | KB |
| Slab Memory | slab 分配器使用的内存量。 | Average | KB |
| Total Memory | 可用总内存量。 | Average | KB |
| Writeback Memory | 处于写回模式的内存量。 | Average | KB |
| Memory Commit Limit (KB) | 内存提交限制(千字节)。 | Average | KB |
| Memory Commit Peak (KB) | 内存提交峰值(千字节)。 | Average | KB |
| Memory Commit Total (KB) | 内存提交总量(千字节)。 | Average | KB |
| Kernel Non-Paged Memory (KB) | 内核非分页内存(千字节)。 | Average | KB |
| Kernel Paged Memory (KB) | 内核分页内存(千字节)。 | Average | KB |
| Kernel Total Memory (KB) | 内核总内存(千字节)。 | Average | KB |
| Memory Page Size | 内存页大小。 | Average | Bytes |
| Physical Available Memory (KB) | 可用物理内存(千字节)。 | Average | KB |
| Physical Total Memory (KB) | 总物理内存(千字节)。 | Average | KB |
| SQL Server Total Memory (KB) | SQL Server 使用的总内存(千字节)。 | Average | KB |
| System Cache Memory (KB) | 系统缓存内存(千字节)。 | Average | KB |
OS 网络
| 指标名称 | 描述 | 统计 | 单位 |
|---|---|---|---|
| Network Receive | 每秒接收的网络数据包数。 | Average | Bytes |
| Network Transmit | 每秒传输的网络数据包数。 | Average | Bytes |
| Network Read Bytes Per Second | 每秒网络读取字节数。 | Average | Bytes |
| Network Write Bytes Per Second | 每秒网络写入字节数。 | Average | Bytes |
OS 交换空间
| 指标名称 | 描述 | 统计 | 单位 |
|---|---|---|---|
| Cached Swap | 已缓存的交换空间量。 | Average | KB |
| Free Swap | 空闲的交换空间量。 | Average | KB |
| Swap In | 每秒换入操作的次数。 | Average | KB |
| Swap Out | 每秒换出操作的次数。 | Average | KB |
| Total Swap | 交换空间的总量。 | Average | KB |
OS 任务
| 指标名称 | 描述 | 统计 | 单位 |
|---|---|---|---|
| Blocked Tasks | 被阻塞的任务数量。 | Average | Count |
| Running Tasks | 当前正在运行的任务数量。 | Average | Count |
| Sleeping Tasks | 处于休眠状态的任务数量。 | Average | Count |
| Stopped Tasks | 已停止的任务数量。 | Average | Count |
| Total Tasks | 任务总数。 | Average | Count |
| Zombie Tasks | 僵尸任务的数量。 | Average | Count |
OS DB SQL 标记化
| 指标名称 | 描述 | 统计 | 单位 |
|---|---|---|---|
| Calls Per Second | 每秒执行的 SQL 调用次数。 | Average | Count per second |
| Rows Per Second | 每秒处理的行数。 | Average | Count per second |
| Total Time Per Second | 每秒执行 SQL 调用所花费的总时间。 | Average | Count per second |
| Shared Blocks Hit Per Second | 每秒命中的共享块数量。 | Average | Count per second |
| Shared Blocks Read Per Second | 每秒读取的共享块数量。 | Average | Count per second |
| Shared Blocks Dirtied Per Second | 每秒被标记为脏的共享块数量。 | Average | Count per second |
| Shared Blocks Written Per Second | 每秒写入的共享块数量。 | Average | Count per second |
| Local Blocks Hit Per Second | 每秒命中的本地块数量。 | Average | Count per second |
| Local Blocks Read Per Second | 每秒读取的本地块数量。 | Average | Count per second |
| Local Blocks Dirtied Per Second | 每秒被标记为脏的本地块数量。 | Average | Count per second |
| Local Blocks Written Per Second | 每秒写入的本地块数量。 | Average | Count per second |
| Local Block Read Time Per Second | 每秒读取本地块所花费的时间。 | Average | Read per second |
| Temporary Blocks Written Per Second | 每秒写入的临时块数量。 | Average | Count per second |
| Temporary Blocks Read Per Second | 每秒读取的临时块数量。 | Average | Count per second |
| Oracle Cache Blocks Hit Per Second | 每秒命中的 Oracle 缓存块数量。 | Average | Count per second |
| Oracle Cache Block Read Time Per Second | 每秒读取 Oracle 缓存块所花费的时间。 | Average | Count per second |
| Storage Blocks Read Per Second | 每秒读取的存储块数量。 | Average | Count per second |
| Storage Block Read Time Per Second | 每秒读取存储块所花费的时间。 | Average | Count per second |
| Block Read Time Per Second | 每秒读取块所花费的时间。 | Average | Count per second |
| Block Write Time Per Second | 每秒写入块所花费的时间。 | Average | Count per second |
| Rows Per Call | 每次调用处理的行数。 | Average | Count |
| Average Latency Per Call | 每次 SQL 调用的平均延迟。 | Average | Millisecond |
| Shared Blocks Hit Per Call | 每次 SQL 调用命中的共享块数量。 | Average | Count |
| Shared Blocks Read Per Call | 每次 SQL 调用读取的共享块数量。 | Average | Count |
| Shared Blocks Written Per Call | 每次 SQL 调用写入的共享块数量。 | Average | Count |
| Shared Blocks Dirtied Per Call | 每次 SQL 调用被标记为脏的共享块数量。 | Average | Count |
| Local Blocks Hit Per Call | 每次 SQL 调用命中的本地块数量。 | Average | Count |
| Local Blocks Read Per Call | 每次 SQL 调用读取的本地块数量。 | Average | Count |
| Local Blocks Dirtied Per Call | 每次 SQL 调用被标记为脏的本地块数量。 | Average | Count |
| Local Blocks Written Per Call | 每次 SQL 调用写入的本地块数量。 | Average | Count |
| Local Block Read Time Per Call | 每次 SQL 调用读取本地块所花费的时间。 | Average | Count |
| Temporary Blocks Written Per Call | 每次 SQL 调用写入的临时块数量。 | Average | Count |
| Temporary Blocks Read Per Call | 每次 SQL 调用读取的临时块数量。 | Average | Count |
| Oracle Cache Blocks Hit Per Call | 每次 SQL 调用命中的 Oracle 缓存块数量。 | Average | Count |
| Oracle Cache Block Read Time Per Call | 每次 SQL 调用读取 Oracle 缓存块所花费的时间。 | Average | Count |
| Storage Blocks Read Per Call | 每次 SQL 调用读取的存储块数量。 | Average | Count |
| Storage Block Read Time Per Call | 每次 SQL 调用读取存储块所花费的时间。 | Average | Count |
| Block Read Time Per Call | 每次 SQL 调用读取块所花费的时间。 | Average | Count |
| Block Write Time Per Call | 每次 SQL 调用写入块所花费的时间。 | Average | Count |
| Count Star Per Second | 每秒 COUNT(*) 查询的次数。 | Average | Count per second |
| Sum of Timer Wait Per Second | 每秒查询等待时间的总和。 | Average | Count per second |
| Sum of Select Full Join Per Second | 每秒全连接操作次数的总和。 | Average | Count per second |
| Sum of Select Range Check Per Second | 每秒范围检查次数的总和。 | Average | Count per second |
| Sum of Select Scan Per Second | 每秒全表扫描操作次数的总和。 | Average | Count per second |
| Sum of Sort Merge Passes Per Second | 每秒排序合并遍历次数的总和。 | Average | Count per second |
| Sum of Sort Scan Per Second | 每秒排序扫描次数的总和。 | Average | Count per second |
| Sum of Sort Range Per Second | 每秒范围排序操作次数的总和。 | Average | Count per second |
| Sum of Sort Rows Per Second | 每秒已排序行数的总和。 | Average | Count per second |
| Sum of Rows Affected Per Second | 每秒受影响行数的总和。 | Average | Count per second |
| Sum of Rows Examined Per Second | 每秒检查行数的总和。 | Average | Count per second |
| Sum of Rows Sent Per Second | 每秒发送行数的总和。 | Average | Count per second |
| Sum of Created Temporary Disk Tables Per Second | 每秒创建临时磁盘表数量的总和。 | Average | Count per second |
| Sum of Created Temporary Tables Per Second | 每秒创建临时表数量的总和。 | Average | Count per second |
| Sum of Lock Time Per Second | 每秒锁定时间的总和。 | Average | Count per second |
| Sum of Timer Wait Per Call | 每次 SQL 调用等待时间的总和。 | Average | Millisecond |
| Sum of Select Full Join Per Call | 每次 SQL 调用全连接操作次数的总和。 | Average | Count |
| Sum of Select Range Check Per Call | 每次 SQL 调用范围检查次数的总和。 | Average | Count |
| Sum of Select Scan Per Call | 每次 SQL 调用全表扫描操作次数的总和。 | Average | Count |
| Sum of Sort Merge Passes Per Call | 每次 SQL 调用排序合并遍历次数的总和。 | Average | Count |
| Sum of Sort Scan Per Call | 每次 SQL 调用排序扫描次数的总和。 | Average | Count |
| Sum of Sort Range Per Call | 每次 SQL 调用范围排序操作次数的总和。 | Average | Count |
| Sum of Sort Rows Per Call | 每次 SQL 调用已排序行数的总和。 | Average | Count |
| Sum of Rows Affected Per Call | 每次 SQL 调用受影响行数的总和。 | Average | Count |
| Sum of Rows Examined Per Call | 每次 SQL 调用检查行数的总和。 | Average | Count |
| Sum of Rows Sent Per Call | 每次 SQL 调用发送行数的总和。 | Average | Count |
| Sum of Created Temporary Disk Tables Per Call | 每次 SQL 调用创建临时磁盘表数量的总和。 | Average | Count |
| Sum of Created Temporary Tables Per Call | 每次 SQL 调用创建临时表数量的总和。 | Average | Count |
| Sum of Lock Time Per Call | 每次 SQL 调用锁定时间的总和。 | Average | Count |
| Execution Count Per Second | 每秒执行次数。 | Average | Count per second |
| Total Elapsed Time Per Second | SQL 执行每秒的总耗时。 | Average | Count per second |
| Total Rows Per Second_sec | 每秒处理的总行数。 | Average | Count per second |
| Total Logical Reads Per Second | 每秒总逻辑读取次数。 | Average | Count per second |
| Total Logical Writes Per Second | 每秒总逻辑写入次数。 | Average | Count per second |
| Total Physical Reads Per Second | 每秒总物理读取次数。 | Average | Count per second |
| Total Worker Time Per Second | SQL 执行每秒的总工作线程时间。 | Average | Count per second |
| Total Elapsed Time Per Call | 每次 SQL 调用的总耗时。 | Average | Count |
| Total Rows Per Call | 每次 SQL 调用处理的总行数。 | Average | Count |
| Total Logical Reads Per Call | 每次 SQL 调用的总逻辑读取次数。 | Average | Count |
| Total Logical Writes Per Call | 每次 SQL 调用的总逻辑写入次数。 | Average | Count |
| Total Physical Reads Per Call | 每次 SQL 调用的总物理读取次数。 | Average | Count |
| Total Worker Time Per Call | 每次 SQL 调用的总工作线程时间。 | Average | Count |
| Execution Plan Count | 生成的执行计划数量。 | Average | Count |
| Executions Per Second | 每秒 SQL 执行次数。 | Average | Count per second |
| Elapsed Time Per Second | SQL 执行每秒的耗时。 | Average | Elapsed time per second |
| Rows Processed Per Second | SQL 执行每秒处理的行数。 | Average | Count per second |
| Buffer Gets Per Second | SQL 执行期间每秒缓冲区获取次数。 | Average | Count per second |
| Physical Read Requests Per Second | SQL 执行期间每秒物理读取请求次数。 | Average | Count per second |
| Physical Write Requests Per Second | SQL 执行期间每秒物理写入请求次数。 | Average | Count per second |
| Total Sharable Memory Per Second | SQL 执行期间每秒使用的总可共享内存。 | Average | Count per second |
| CPU Time Per Second | SQL 执行期间每秒使用的总 CPU 时间。 | Average | Count per second |
| Elapsed Time Per Execution | 每次 SQL 执行的耗时。 | Average | Count |
| Rows Processed Per Execution | 每次 SQL 执行处理的行数。 | Average | Count |
| Buffer Gets Per Execution | 每次 SQL 执行的缓冲区获取次数。 | Average | Count |
| Physical Read Requests Per Execution | 每次 SQL 执行的物理读取请求次数。 | Average | Count |
| Physical Write Requests Per Execution | 每次 SQL 执行的物理写入请求次数。 | Average | Count |
| Total Sharable Memory Per Execution | 每次 SQL 执行使用的总可共享内存。 | Average | Count |
| CPU Time Per Execution | 每次 SQL 执行使用的总 CPU 时间。 | Average | Count |
DB 缓存
| 指标名称 | 描述 | 统计 | 单位 |
|---|---|---|---|
| Blocks Hit | 缓存中命中的块数量。 | Average | Blocks per second |
| Buffers Allocated | 缓存中分配的缓冲区数量。 | Average | Blocks per second |
| InnoDB Buffer Pool Reads | 从 InnoDB 缓冲池读取的次数。 | Average | Pages per second |
| InnoDB Buffer Pool Read Requests | 来自 InnoDB 缓冲池的读取请求次数。 | Average | Pages per second |
| InnoDB Buffer Pool Pages Data | InnoDB 缓冲池中的数据页数量。 | Average | Count |
| InnoDB Buffer Pool Pages Total | InnoDB 缓冲池中的总页数。 | Average | Count |
| Opened Tables | 缓存中已打开的表数量。 | Average | Count |
| Opened Table Definitions | 缓存中已打开的表定义数量。 | Average | Count |
| InnoDB Buffer Pool Hit Rate | InnoDB 缓冲池中的命中次数。 | Average | Pages per second |
| InnoDB Buffer Pool Hits | InnoDB 缓冲池的命中率百分比。 | Average | Percentage |
| InnoDB Buffer Pool Usage | InnoDB 缓冲池的使用率百分比。 | Average | Percentage |
| Query Cache Hits | 查询缓存命中次数。 | Average | Count |
| Query Cache Hit Rate | 查询缓存命中率百分比。 | Average | Percentage |
| Physical Read Bytes | 物理读取的字节数。 | Average | Bytes |
| Database Block Gets | 数据库块获取次数。 | Average | Count |
| Database Writer Checkpoints | 数据库写入程序(DBWR)检查点次数。 | Average | Count |
| Physical Reads | 物理读取次数。 | Average | Count |
| Consistent Gets From Cache | 从缓存中一致性读取的次数。 | Average | Count |
| Database Block Gets From Cache | 从缓存中获取数据库块的次数。 | Average | Count |
| Consistent Gets | 一致性读取的次数。 | Average | Count |
DB 检查点
| 指标名称 | 描述 | 统计 | 单位 |
|---|---|---|---|
| Buffers Checkpoint | 检查点期间写入磁盘的缓冲区数量。 | Average | Blocks per second |
| Checkpoint Sync Time | 检查点期间同步所需的时间。 | Average | Milliseconds per checkpoint |
| Checkpoint Write Time | 检查点期间写入数据所需的时间。 | Average | Milliseconds per checkpoint |
| Requested Checkpoints | 请求的检查点数量。 | Average | Checkpoints per minute |
| Timed Checkpoints | 定时检查点的数量。 | Average | Checkpoints per minute |
| Max Written Clean | 检查点期间由清理写入程序写入的缓冲区数量。 | Average | Bgwriter clean stops per minute |
| Checkpoint Sync Latency | 检查点期间同步的延迟。 | Average | Milliseconds per checkpoint |
| Checkpoint Write Latency | 检查点期间写入的延迟。 | Average | Milliseconds per checkpoint |
DB 并发
| 指标名称 | 描述 | 统计 | 单位 |
|---|---|---|---|
| Deadlocks | 检测到的死锁数量。 | Average | Deadlocks per minute |
DB IO
| 指标名称 | 描述 | 统计 | 单位 |
|---|---|---|---|
| Block Read Time | 从数据库读取块所花费的时间。 | Average | Milliseconds |
| Blocks Read | 从数据库读取的块数量。 | Average | Blocks per second |
| Buffers Backend | 后端分配的缓冲区数量。 | Average | Blocks per second |
| Buffers Backend Fsync | 后端的 fsync 操作次数。 | Average | Blocks per second |
| Storage Blocks Read | 后台写入程序清理的缓冲区数量。 | Average | Blocks per second |
| Storage Block Read Time | 读取存储块的次数。 | Average | Blocks per second |
| Oracle Cache Blocks Hit | Oracle 缓存中命中的块数量。 | Average | Blocks per second |
| Oracle Cache Block Read Time | 从 Oracle 缓存读取块所花费的时间。 | Average | Milliseconds |
| Local Blocks Read | 读取的本地块数量。 | Average | Blocks per second |
| Local Block Read Time | 读取本地块所花费的时间。 | Average | Milliseconds |
| InnoDB Pages Written | 写入磁盘的 InnoDB 页数。 | Average | Pages per second |
| InnoDB Data Writes | InnoDB 中的数据写入次数。 | Average | Operations per second |
| InnoDB Log Writes | InnoDB 中的日志写入次数。 | Average | Operations per second |
| InnoDB Log Write Requests | InnoDB 中的日志写入请求次数。 | Average | Operations per second |
| InnoDB Double Writes | InnoDB 中的双写操作次数。 | Average | Operations per second |
| InnoDB Datafile Writes to Disk | InnoDB 中数据文件写入磁盘的操作次数。 | Average | Operations per second |
DB SQL
| 指标名称 | 描述 | 统计 | 单位 |
|---|---|---|---|
| Tuples Deleted | 已删除的元组(行)数量。 | Average | Tuples per second |
| Tuples Fetched | 已获取的元组(行)数量。 | Average | Tuples per second |
| Tuples Inserted | 已插入的元组(行)数量。 | Average | Tuples per second |
| Tuples Returned | 已返回的元组(行)数量。 | Average | Tuples per second |
| Tuples Updated | 已更新的元组(行)数量。 | Average | Tuples per second |
| Queries Started | 已启动的查询数量。 | Average | Queries per second |
| Queries Finished | 已完成的查询数量。 | Average | Queries per second |
| Total Query Time | 执行查询所花费的总时间。 | Average | Milliseconds |
| Logical Reads | 从数据库进行的逻辑读取次数。 | Average | Blocks per second |
| COM Analyze | 执行的 ANALYZE 命令次数。 | Average | Queries per second |
| COM Optimize | 执行的 OPTIMIZE 命令次数。 | Average | Queries per second |
| InnoDB Rows Inserted | 执行的 SELECT 查询次数。 | Average | Queries per second |
| InnoDB Rows Deleted | InnoDB 中插入的行数。 | Average | Rows per second |
| db.sql.Innodb_rows_deleted | InnoDB 中删除的行数。 | Average | Rows per second |
| InnoDB Rows Updated | InnoDB 中更新的行数。 | Average | Rows per second |
| db.sql.Innodb_rows_read | InnoDB 中读取的行数。 | Average | Rows per second |
| InnoDB Rows Read | 发送到服务器的查询(问题)数量。 | Average | Queries per second |
| Queries | 执行的查询数量。 | Average | Queries per second |
| Select Full Join | SELECT 查询中的全连接次数。 | Average | Queries per second |
| Select Full Range Join | SELECT 查询中的全范围连接次数。 | Average | Queries per second |
| Select Range | 范围 SELECT 查询的数量。 | Average | Queries per second |
| Select Range Check | SELECT 中范围检查查询的数量。 | Average | Queries per second |
| Select Scan | SELECT 查询中全表扫描的次数。 | Average | Queries per second |
| Slow Queries | 执行的慢查询数量。 | Average | Queries per second |
| Sort Merge Passes | 排序中的合并遍历次数。 | Average | Queries per second |
| Sort Range | 范围排序的次数。 | Average | Queries per second |
| Sort Rows | 已排序的行数。 | Average | Queries per second |
| Sort Scan | 扫描排序的次数。 | Average | Queries per second |
| Total Query Time | 查询所花费的总时间。 | Average | Milliseconds |
| InnoDB Rows Changed | InnoDB 中更改的行数。 | Average | Rows per second |
| Parse Count Total | 执行的解析总次数。 | Average | Count |
| Parse Count Hard | 执行的硬解析次数。 | Average | Count |
| Table Scan Rows Gotten | 通过全表扫描获取的行数。 | Average | Count |
| Sorts in Memory | 在内存中执行的排序次数。 | Average | Count |
| Sorts on Disk | 在磁盘上执行的排序次数。 | Average | Count |
| Sorts Rows | 已排序的行数。 | Average | Count |
DB 临时空间
| 指标名称 | 描述 | 统计 | 单位 |
|---|---|---|---|
| Temporary Bytes | 临时文件使用的总字节数。 | Average | Bytes |
| Temporary Files | 已创建的临时文件数量。 | Average | Files per minute |
| Created Temporary Disk Tables | 已创建的临时磁盘表数量。 | Average | Tables per second |
| Created Temporary Tables | 已创建的临时表数量。 | Average | Tables per second |
| Temporary Disk Tables Percent | 在磁盘上创建的临时表所占的百分比。 | Average | Percentage |
DB 事务
| 指标名称 | 描述 | 统计 | 单位 |
|---|---|---|---|
| Blocked Transactions | 当前被阻塞的事务数量。 | Average | Count |
| Maximum Used Transaction IDs | 已使用的最大事务 ID 数。 | Average | Count |
| Transaction Commits | 事务提交总次数。 | Average | Commits per second |
| dTransaction Rollbacks | 事务回滚总次数。 | Average | Rollbacks per second |
| Duration of Commits | 事务提交的持续时间。 | Average | Milliseconds |
| Commit Latency | 事务提交的延迟。 | Average | Milliseconds per Transaction |
| Active Transactions | 当前活动事务的数量。 | Average | Count |
| Transaction Rollback Segment History Length | 事务回滚段历史记录的长度。 | Average | Count |
DB 用户
| 指标名称 | 描述 | 统计 | 单位 |
|---|---|---|---|
| Number of Backends | 该用户的活动后端数量。 | Average | Count |
| Total Authentication Attempts | 该用户的身份验证尝试总次数。 | Average | Count |
| Maximum Connections | 该用户允许的最大连接数。 | Average | Count |
| CPU Used by This Session | 当前用户会话的 CPU 使用量。 | Average | Count |
| SQL Net Roundtrips to/from Client | 往返客户端的 SQL*Net 往返次数。 | Average | Count |
| Bytes Received via SQL Net from Client | 通过 SQL*Net 从客户端接收的字节数。 | Average | Bytes |
| User Commits | 用户执行的提交次数。 | Average | Count |
| Cumulative Logons | 用户的累计登录总次数。 | Average | Count |
| User Calls | 用户发出的调用总次数。 | Average | Count |
| Bytes Sent via SQL Net to Client | 通过 SQL*Net 发送到客户端的字节数。 | Average | Bytes |
| User Rollbacks | 用户执行的回滚次数。 | Average | Count |
DB WAL
| 指标名称 | 描述 | 统计 | 单位 |
|---|---|---|---|
| WAL Archived Count | 已归档的预写日志(WAL)总数。 | Average | Files per minute |
| WAL Archive Failed Count | 预写日志归档失败的总次数。 | Average | Files per minute |
DB 状态
| 指标名称 | 描述 | 统计 | 单位 |
|---|---|---|---|
| Active Count | 活动数据库连接的数量。 | Average | Count |
| Idle Count | 空闲数据库连接的数量。 | Average | Count |
| Idle in Transaction Count | 事务中空闲连接的数量。 | Average | Count |
| Idle in Transaction Aborted Counton_aborted_count | 已中止事务中空闲连接的数量。 | Average | Count |
| Idle in Transaction Max Time | 连接在事务中处于空闲状态的最长时间。 | Average | Count |
DB 锁
| 指标名称 | 描述 | 统计 | 单位 |
|---|---|---|---|
| InnoDB Row Lock Time | 等待 InnoDB 行锁所花费的时间。 | Average | Milliseconds |
| InnoDB Row Lock Waits | 等待 InnoDB 行锁的次数。 | Average | Count |
| InnoDB Deadlocks | InnoDB 死锁的数量。 | Average | Deadlocks per minute |
| InnoDB Lock Timeouts | InnoDB 锁超时的次数。 | Average | Count |
| Table Locks Immediate | 立即获得的表锁数量。 | Average | Requests per Second |
| Table Locks Waited | 需要等待的表锁数量。 | Average | Requests per Second |
| Total Number of Deadlocks | 数据库中死锁的总数量。 | Average | Count |
DB 用户连接
| 指标名称 | 描述 | 统计 | 单位 |
|---|---|---|---|
| User Connections | 用户连接总数。 | Average | Count |
| Maximum Connections | 允许的最大用户连接数。 | Average | Count |
| Aborted Clients | 被客户端中止的连接数量。 | Average | Count |
| Aborted Connects | 失败的连接尝试次数。 | Average | Count |
| Threads Running | 当前正在运行的线程数量。 | Average | Count |
| Threads Created | 已创建的线程总数。 | Average | Count |
| Threads Connected | 当前已连接的线程数量。 | Average | Count |
OS 系统
| 指标名称 | 描述 | 统计 | 单位 |
|---|---|---|---|
| System Handles | 正在使用的系统句柄数量。 | Average | Count |
| System Processes | 正在运行的系统进程数量。 | Average | Count |
| System Threads | 活动的系统线程数量。 | Average | Count |
DB 访问方法
| 指标名称 | 描述 | 统计 | 单位 |
|---|---|---|---|
| Access Methods Page Splits | 数据库中发生的页面分裂次数。 | Average | Count |
| Access Methods Forwarded Records | 数据库中转发记录的数量。 | Average | Count |
OS 磁盘
| 指标名称 | 描述 | 统计 | 单位 |
|---|---|---|---|
| Available Kilobytes | 可用磁盘空间(千字节)。 | Average | KB |
| Available Percent | 可用磁盘空间的百分比。 | Average | Percentage |
| Read Bytes per Second | 每秒磁盘读取字节数。 | Average | Bytes write/s |
| Read Count per Second | 每秒磁盘读取次数。 | Average | Count |
| Total Kilobytes | 磁盘总空间(千字节)。 | Average | KB |
| Used Kilobytes | 已使用磁盘空间(千字节)。 | Average | KB |
| Used Percent | 已使用磁盘空间的百分比。 | Average | Percentage |
| Write Bytes per Second | 每秒磁盘写入字节数。 | Average | Bytes write/s |
| Write Count per Second | 每秒磁盘写入次数。 | Average | Count |
DB 数据库
| 指标名称 | 描述 | 统计 | 单位 |
|---|---|---|---|
| Total Active Transactions | 活动事务的总数量。 | Average | Count |
| Total Active Transactions | 已刷新的日志字节总数。 | Average | Count |
| Total Log Flush Waits | 日志刷新等待的总次数。 | Average | Count |
| Total Log Flushes | 日志刷新的总次数。 | Average | Count |
| Total Log Flushes | 写入事务的总数量。 | Average | Count |
DB 常规统计
| 指标名称 | 描述 | 统计 | 单位 |
|---|---|---|---|
| Blocked Processes | 当前被阻塞的进程总数。 | Average | |
| User Connections | 用户连接的总数量。 | Average |
DB 锁存器
| 指标名称 | 描述 | 统计 | 单位 |
|---|---|---|---|
| Latch Waits | 锁存器等待的总次数。 | Average | Count |
DB 内存管理器
| 指标名称 | 描述 | 统计 | 单位 |
|---|---|---|---|
| Memory Manager Memory Grants Pending | 待处理的内存授权数量。 | Average | Count |
DB SQL 统计
| 指标名称 | 描述 | 统计 | 单位 |
|---|---|---|---|
| Batch Requests | 批处理请求的总数量。 | Average | Count |
| SQL Compilations | SQL 编译的次数。 | Average | Count |
| SQL Re-Compilations | SQL 重新编译的次数。 | Average | Count |
DB 缓冲区管理器
| 指标名称 | 描述 | 统计 | 单位 |
|---|---|---|---|
| Page Life Expectancy | 页面在缓冲池中停留的平均秒数。 | Average | Count |
| Buffer Cache Hit Ratio | 由缓冲区缓存满足的页面请求百分比。 | Average | Count |
| Page Lookups | 页面查找的总次数。 | Average | Count |
| Page Reads | 从磁盘读取的页面总数。 | Average | Count |
| Page Writes | 写入磁盘的页面总数。 | Average | Count |
DB SQL 查询
| 指标名称 | 描述 | 统计 | 单位 |
|---|---|---|---|
| Execution Count per Second | 每秒 SQL 执行的总次数。 | Average | Count per second |
| Total Elapsed Time per Second | 每秒 SQL 执行的总耗用时间。 | Average | Seconds |
| Total Rows per Second | 每秒处理的行数总量。 | Average | Count per second |
| Total Logical Reads per Second | 每秒的逻辑读取总量。 | Average | Count per second |
| Total Logical Writes per Second | 每秒的逻辑写入总量。 | Average | Count per second |
| Total Physical Reads per Second | 每秒的物理读取总量。 | Average | Count per second |
| Total Worker Time per Second | 每秒的工作线程时间总量。 | Average | Count per second |
| Total Elapsed Time per Call | 每次调用的总耗用时间。 | Average | Count |
| Total Rows per Call | 每次调用处理的行数总量。 | Average | Count |
| Total Logical Reads per Call | 每次调用的逻辑读取总量。 | Average | Count |
| Total Logical Writes per Call | 每次调用的逻辑写入总量。 | Average | Count |
| Total Physical Reads per Call | 每次调用的物理读取总量。 | Average | Count |
| Total Worker Time per Call | 每次调用的工作线程时间总量。 | Average | Count |
| Execution Plan Count | 执行计划的总数量。 | Average | Count |
| Executions per Second | 每秒执行的总次数。 | Average | Count per second |
| Elapsed Time per Second | 每秒的耗用时间。 | Average | Count per second |
| Rows Processed per Second | 每秒处理的行数。 | Average | Count per second |
| Buffer Gets per Second | 每秒的缓冲区获取总量。 | Average | Count per second |
| Physical Read Requests per Second | 每秒的物理读取请求总量。 | Average | Count per second |
| Physical Write Requests per Second | 每秒的物理写入请求总量。 | Average | Count per second |
| Total Sharable Memory per Second | 每秒的可共享内存总量。 | Average | Count per second |
| CPU Time per Second | 每秒使用的 CPU 时间。 | Average | Count per second |
| Elapsed Time per Execution | 每次执行的耗用时间。 | Average | Count |
| Rows Processed per Execution | 每次执行处理的行数。 | Average | Count |
| Buffer Gets per Execution | 每次执行的缓冲区获取量。 | Average | Count |
| Physical Read Requests per Execution | 每次执行的物理读取请求量。 | Average | Count |
| Physical Write Requests per Execution | 每次执行的物理写入请求量。 | Average | Count |
| Total Sharable Memory per Execution | 每次执行的可共享内存总量。 | Average | Count |
| CPU Time per Execution | 每次执行使用的 CPU 时间。 | Average | Count |
DB 重做
| 指标名称 | 描述 | 统计 | 单位 |
|---|---|---|---|
| Redo Size | 重做日志的总大小。 | Average | Bytes |
配置详情
| 属性 | 描述 |
|---|---|
| Instance identifier | 显示 DB 实例的唯一标识符。 |
| Instance class | 显示 RDS DB 实例类型。 |
| vCPUs | 显示 DB 实例类型的虚拟核心数量。 |
| Memory | 显示 RDS 实例类型的内存容量。 |
| Allocated storage space | 显示实例类型的已分配存储容量。 |
| Creation time | 显示 DB 实例的创建时间。 |
| Engine name | 显示 DB 引擎的名称。 |
| Engine version | 显示指定 DB 引擎的默认版本。 |
| Master username | 显示 RDS 数据库的主用户名。 |
| Database name | 显示默认数据库的名称。 |
| Region | DB 实例所部署的区域。 |
| Availability zone | 副本所部署的可用区。 |
| VPC ID | DB 实例所在虚拟私有云的 ID。 |
| Security groups | 显示分配给 DB 实例的安全组名称。 |
| Endpoint address | 显示数据库的连接终端节点地址。 |
| Endpoint port | 显示数据库接受连接的端口号。 |
| Multiple deployment | 显示 DB 实例是否属于多可用区部署。 |
| Preferred back up window | 显示在 DB 实例创建期间配置的首选备份时间窗口。 |
| Latest restorable time | 显示 DB 实例的最新可恢复时间。 |
| Back up retention period | 显示 DB 实例的备份保留期限。 |
| Preferred maintenance window | 显示 DB 集群的首选维护时间窗口。 |
了解如何为已监控的 RDS 实例配置阈值配置文件。
预测
预测以下性能指标的未来值,以便在扩充容量或扩展 AWS 基础设施方面做出明智决策。
- CPU Utilization
- Free Storage Space
- Freeable Memory
- Swap Usage
- Bin Log Disk Usage
- Burst Balance
- Disk Queue Depth
- Transaction Logs Disk Usage
- CPU Credit Usage
- CPU Credit Balance
- CPU Surplus Usage
- CPU Surplus Balance
- Aurora Bin Log
- Free Local Storage
- Volume Read IOPs
- Volume Write IOPs
- Memory Utilization
许可
- RDS Instance:每个 Amazon RDS Instance 监视器使用一个基础监视器许可。
- RDS Performance Insights:每个 RDS Performance Insights 监视器使用一个高级监视器许可。
- Amazon RDS Cluster:每个 Amazon RDS Cluster 监视器使用一个基础监视器许可。
监视器数据
Amazon RDS Instance
您可以在以下标签页中查看 Amazon RDS Instance 监视器数据:
RDS Instance Information
RDS Instance Information 标签页以图表形式提供事件时间线和各项指标的概览。
Aurora DB metrics
查看 Amazon RDS Aurora 的实时性能指标,例如 Aurora Parallel Query Request、Forwarding Writer Performance 以及 Aurora 容量单位(ACU)指标。
Topology View
Topology View 标签页提供实时的以资源为中心的依赖关系图。它能动态追踪您的 RDS Instance 资源与周边 AWS 基础设施的实时连接关系,在告警触发时加快根本原因定位。如果任何关联组件处于严重状态,该组件将在拓扑视图中相应标记,并显示中断原因,让您无需离开监视器页面即可精确定位故障点。与账户级拓扑视图不同,此标签页将可视化范围限定在单个资源,以精确回答:此 RDS Instance 资源连接到哪些对象,以及该资源发生故障时会影响什么?您可以从单个资源向上追踪完整的依赖链,直至其主要父实体、服务类型、区域和 AWS 账户层级。
Zia Forecast
Zia Forecast 标签页显示预测图表,基于历史时间序列数据展示性能指标(资源使用量度量)的未来走势。系统使用最多 30 天的历史数据来预测未来七天的指标使用情况。
Configuration Details
Configuration Details 标签页提供 RDS 实例的关键详情,例如实例标识符、区域、实例类型和创建时间。
Events
Events 标签页显示 RDS 实例的重要活动和变更,例如备份、维护和状态变更。
Logs
Logs 标签页显示用于监控和故障排除 AWS RDS 实例的错误日志。
Performance Insights
Performance Insights 标签页为 Amazon RDS 提供详细的性能指标,包括总体数据库负载(DBLOAD)、CPU 相关负载(DBLOADCPU)和非 CPU 相关负载(DBLOADNONCPU)。点击相应的监视器名称可获取每种 Performance Insights 监视器类型的详细分析。
Outages
Outages 标签页提供中断的开始时间、结束时间、持续时间及备注(如有)。
Inventory
在 Inventory 标签页中获取资源名称、区域和监视器许可类别等详情。可按用户设置阈值与可用性配置文件及通知配置文件,并在此标签页查看。
Log Report
此标签页提供每个 RDS 监视器日志状态的汇总报表,可下载为 CSV 文件。
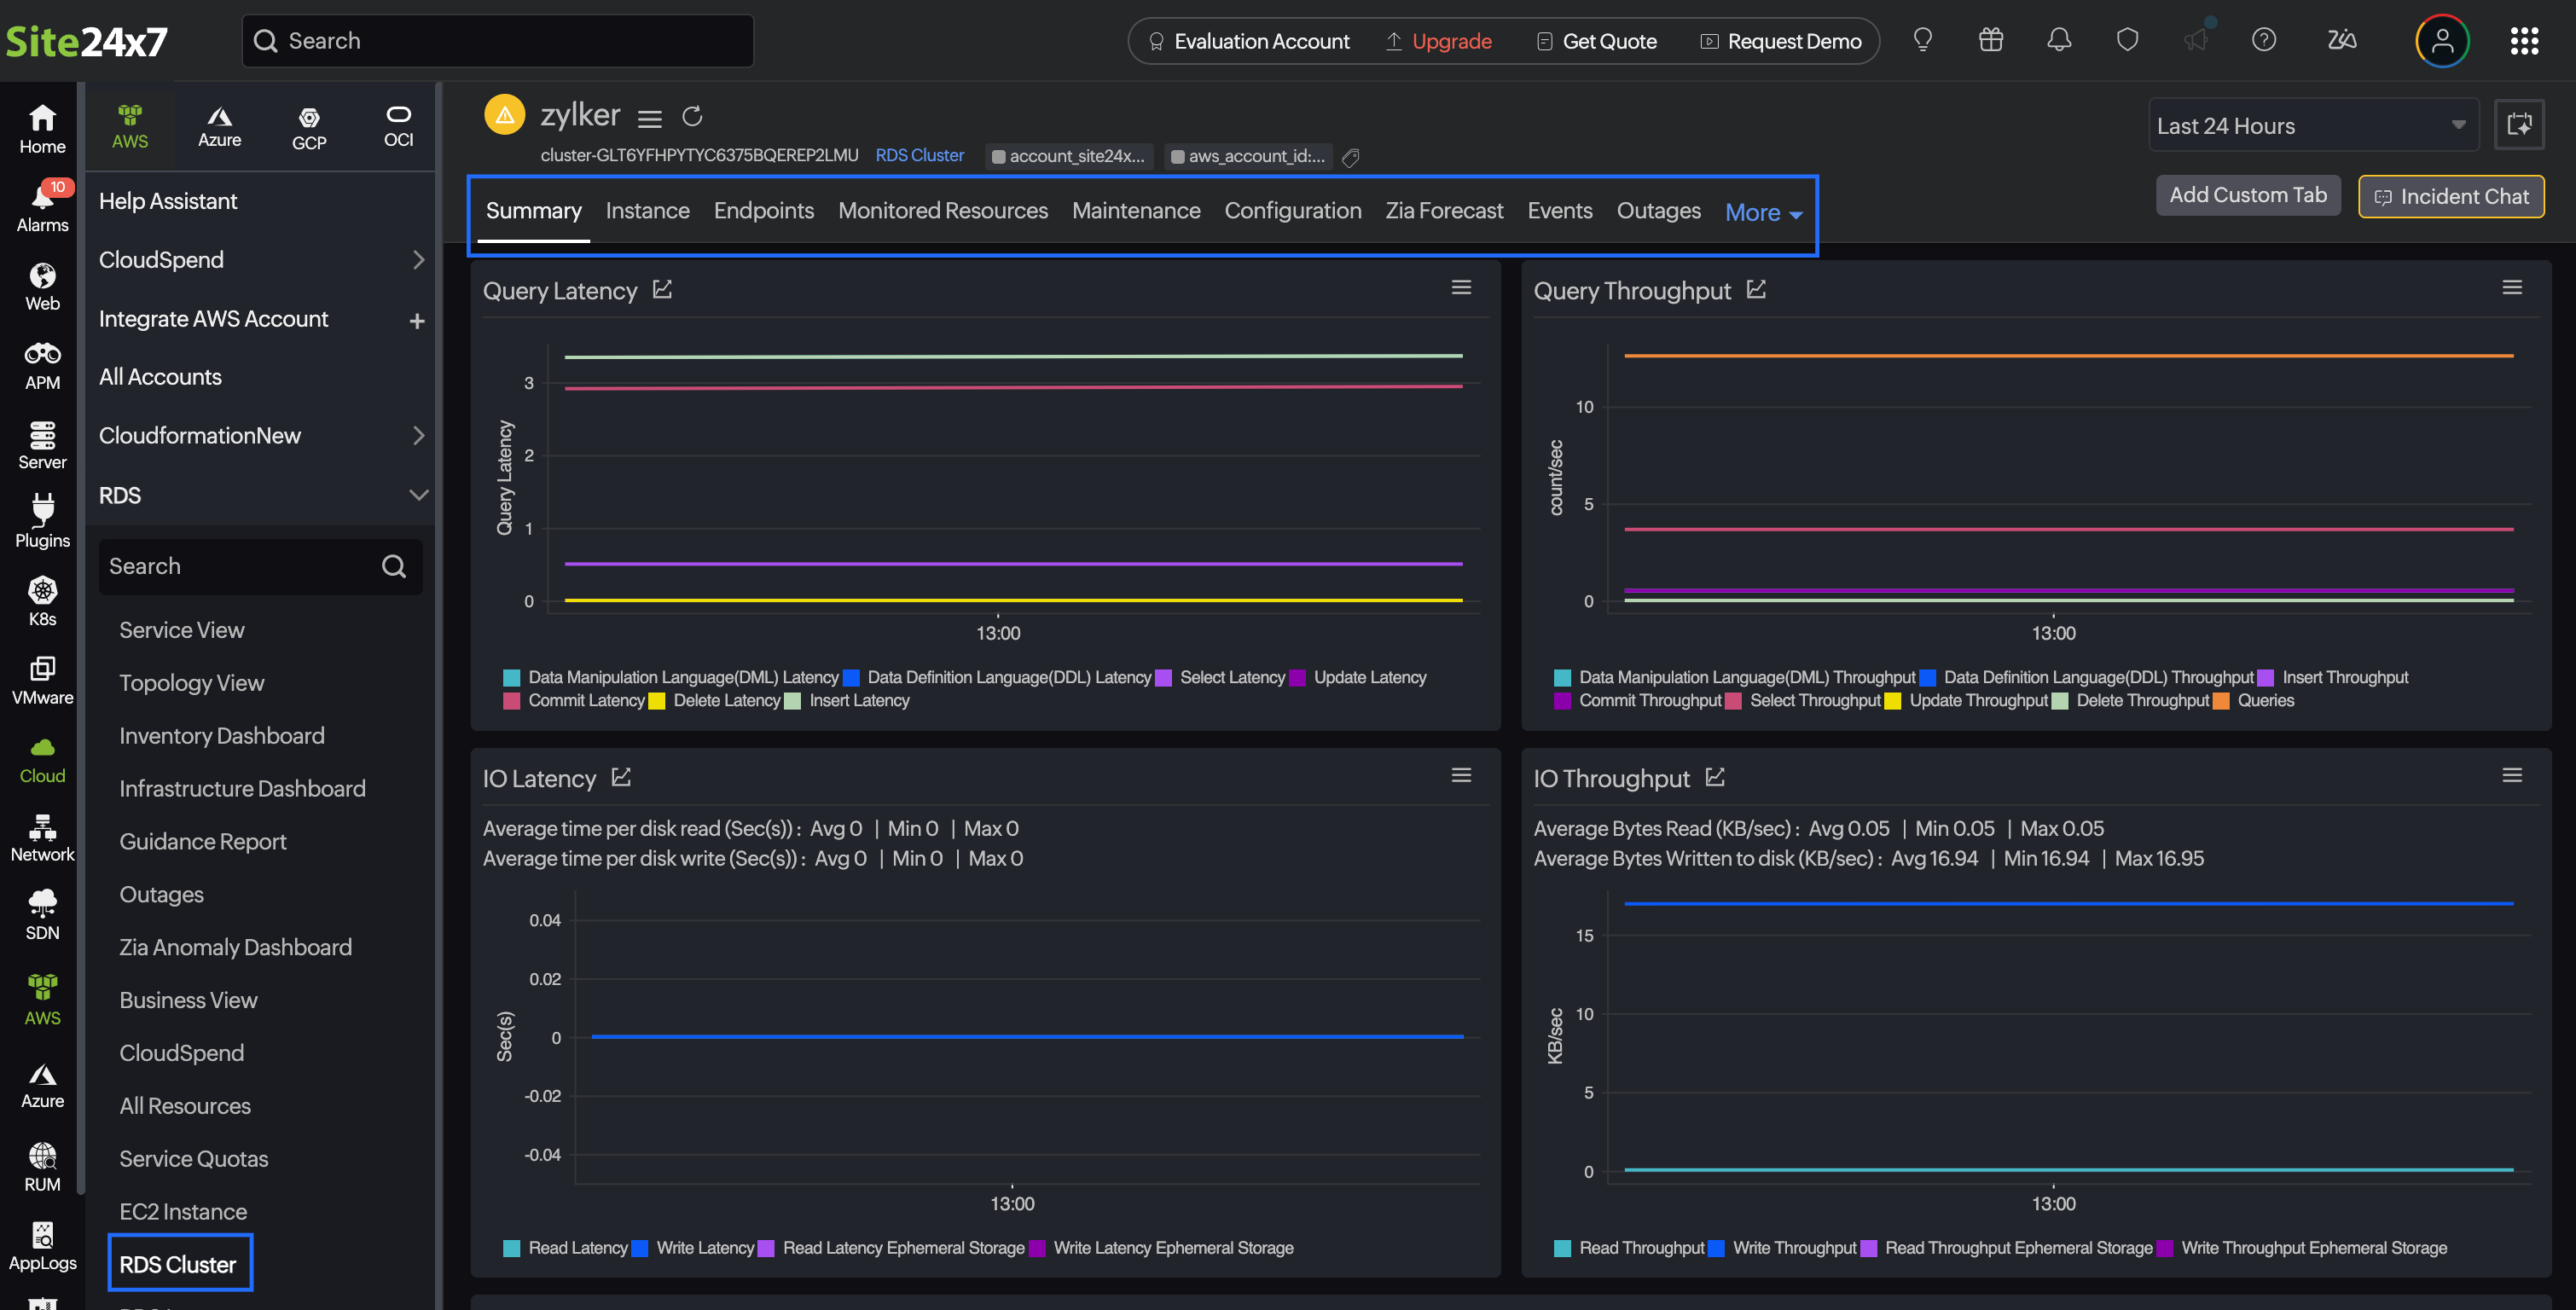
RDS Cluster
您可以在以下标签页中查看 RDS Cluster 监视器数据:
Summary
Summary 标签页以图表形式提供事件时间线和各项指标的概览。
Topology View
Topology View 标签页提供实时的以资源为中心的依赖关系图。它能动态追踪您的 RDS Cluster 资源与周边 AWS 基础设施的实时连接关系,在告警触发时加快根本原因定位。如果任何关联组件处于严重状态,该组件将在拓扑视图中相应标记,并显示中断原因,让您无需离开监视器页面即可精确定位故障点。与账户级拓扑视图不同,此标签页将可视化范围限定在单个资源,以精确回答:此 RDS Cluster 资源连接到哪些对象,以及该资源发生故障时会影响什么?您可以从单个资源向上追踪完整的依赖链,直至其主要父实体、服务类型、区域和 AWS 账户层级。
Write Forwarding
Write Forwarding 标签页显示与写入转发相关的指标,仅在集群启用写入转发时可用。
Parallel Query
Parallel Query 标签页显示与并行查询相关的指标,仅在启用并行查询时可用。
Instance
此标签页列出与集群关联的所有子 RDS 实例监视器。
Endpoints
Endpoints 标签页列出为集群配置的所有读取器、写入器和自定义终端节点。
Maintenance
Maintenance 标签页列出所有待处理的维护任务及维护窗口设置。
Monitored Resource
Monitored Resources 标签页显示与您的 RDS Cluster 关联并由 Site24x7 监控的后端 AWS 资源。点击所需的监视器名称链接可查看监视器详情。
Configuration
Configuration 标签页提供 RDS 实例的关键详情,例如集群名称、实例状态和创建日期。
Zia Forecast
Zia 预测图表基于历史时间序列数据展示性能指标(资源使用量度量)的未来走势。系统使用 30 天的历史数据来预测未来七天的指标使用情况。
Events
Events 标签页显示 RDS 集群的重要活动和变更,例如时间戳、消息和事件。
Outages
Outages 标签页提供中断的开始时间、结束时间、持续时间及备注(如有)。
Inventory
在 Inventory 标签页中获取资源名称、区域和监视器许可类别等详情。可按用户设置阈值与可用性配置文件及通知配置文件,并在此标签页查看。
Log Report
此标签页提供每个 RDS 监视器日志状态的汇总报表,可下载为 CSV 文件。
RDS Performance Insights
您可以在以下标签页中查看 RDS Performance Insights 监视器数据:
Summary
Summary 标签页以图表形式提供事件时间线和各项指标的概览。
Topology View
Topology View 标签页提供实时的以资源为中心的依赖关系图。它能动态追踪您的 RDS Performance Insights 资源与周边 AWS 基础设施的实时连接关系,在告警触发时加快根本原因定位。如果任何关联组件处于严重状态,该组件将在拓扑视图中相应标记,并显示中断原因,让您无需离开监视器页面即可精确定位故障点。与账户级拓扑视图不同,此标签页将可视化范围限定在单个资源,以精确回答:此 RDS Performance Insights 资源连接到哪些对象,以及该资源发生故障时会影响什么?您可以从单个资源向上追踪完整的依赖链,直至其主要父实体、服务类型、区域和 AWS 账户层级。
RDS Performance Insights 的所有子监视器,例如 OS General、OS CPU Utilization 和 OS Disk IO,均以标签页形式显示在 Topology 标签页之后。