Monitor Kubernetes
Monitor the different components of your container infrastructure using Site24x7's Kubernetes Monitoring and get a complete picture of the health and performance of your Kubernetes clusters.
- Add a monitor
DaemonSets | Helm chart - Edit Monitor
- Dashboards: Health | Inventory
- Business View
- Performance metrics:
- Container logs
- Reports
- Security
- Licensing
- FAQs
Add a Monitor
Site24x7 supports Kubernetes monitoring in the following cloud platforms: On premise, Azure (Azure Kubernetes Engine), AWS (Elastic Kubernetes Service), and GCP (Google Kubernetes Engine).
- Log in to your Site24x7 account and go to Server > Kubernetes > Clusters (+) > Add Kubernetes Monitor.
- Select the platform where your Kubernetes clusters are running - On premise, Azure (AKS), Google Cloud Platform (GKE), or Amazon Web Services (EKS).
- Configure Role-based Access Control (RBAC) permissions and install the Site24x7 agent as DaemonSet:
- Download the site24x7-agent.yaml file from the Add Kubernetes Monitor page in the Site24x7 web client.
- Copy the downloaded file and save it in your Azure CLI/GCP Cloud Shell/AWS control plane/on premise master node terminal.
- Replace the device key that is given in the Site24x7 web client.
- If you have proxy, refer the below section to configure it.
- Then, execute the following command:
kubectl apply -f site24x7-agent.yaml
- Configure kube-state-metrics: Download the site24x7-kube-state-metrics.yamlfile and save it in your Azure CLI/GCP Cloud shell/AWS control plane/on premise master node terminal. Execute the following command to apply the YAML.
kubectl apply -f site24x7-kube-state-metrics.yamlAlternatively, you can execute the following command to download and configure the kube-state-metrics:curl -L -o kube-state-metrics-1.9.7.zip https://github.com/kubernetes/kube-state-metrics/archive/v1.9.7.zip && unzip kube-state-metrics-1.9.7.zip && kubectl apply -f kube-state-metrics-1.9.7/examples/standardThis is an optional step. But, this file is essential to view the complete set of performance metrics for nodes, pods, containers, deployments and other features like the Health dashboard.
Ensure the site24x7-agent pods are created and in running state. Please wait a few minutes for all of your nodes, containers, pods, deployments, HPA, and ReplicaSets to be added in Site24x7's web client. Once discovery is complete, you'll be directed to the Health dashboard.
If the set up has proxy, uncomment the following lines under env in the site24x7-agent.yaml file and update the proxy value:
value: http://192.108.100.100:1118
- name: https_proxy
value: https://192.108.100.100:1118
Method 2: Helm chart
Follow the below steps to install your Site24x7 Kubernetes Agent using Helm chart:
- Install Helm.
- Add the Site24x7 Helm Repository by executing the following commands:
helm repo add site24x7 https://site24x7.github.io/helm-charts/
helm repo update - Fetch the Device Key from Admin > Developer > Device Key.
- Deploy the agent using the following command:
If you are using Helm version: 3 or above, use the below command:
helm install <RELEASE_NAME> --set site24x7.device_key='' site24x7/site24x7agent
If you are using Helm version: 2, use the below command:
helm install --name <RELEASE_NAME> --set site24x7.device_key='' site24x7/site24x7agent
Proxy configuration: Set the proxy configuration as one of the install parameters to the Helm install command.
Sample:
Sample with proxy authentication:
The Helm chart adds Site24x7 Kubernetes Agent to all the nodes in your cluster via a DaemonSet. In addition, it also deploys the kube-state-metrics as a deployment for fetching performance metrics.
Once the kube-state-metrics is deployed, Site24x7 Kubernetes Agent reports the hosts and the metrics data in your account.
Dashboards
There are two exclusive dashboards for Kubernetes in Site24x7. You can also create custom dashboards.
Health Dashboard
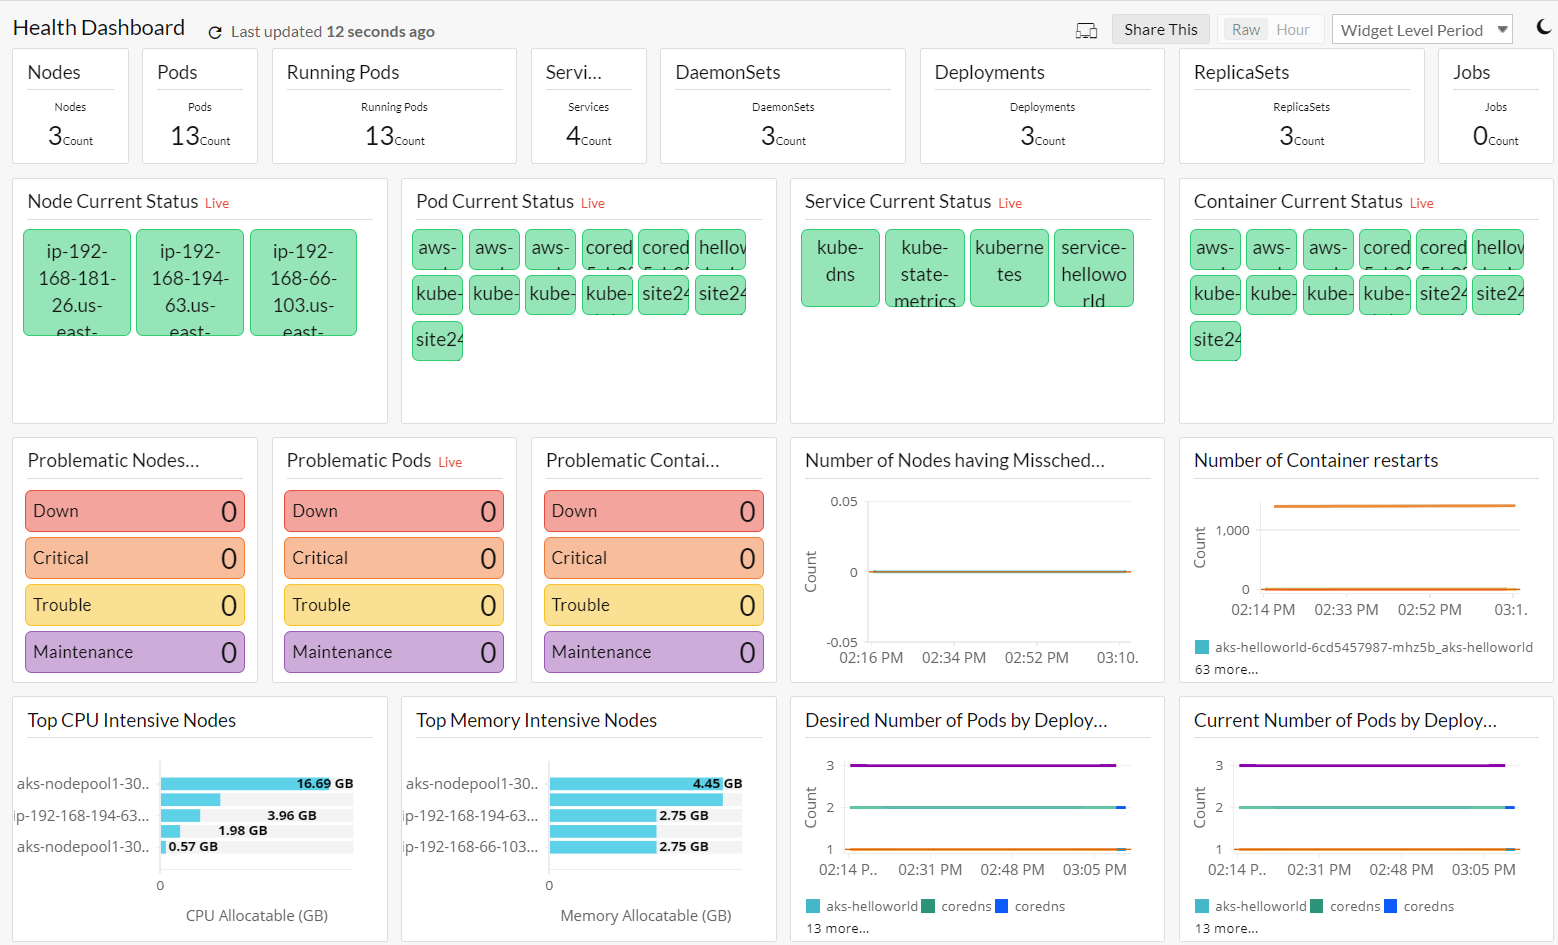
Once you've successfully added a Kubernetes monitor, you'll be directed to the Health dashboard. This represents a single view of all critical components of your Kubernetes infrastructure.
Highlights:
- See the total number of all the nodes, pods, services, DaemonSets, deployments, ReplicaSets, and jobs in one view.
- View the current status of all the nodes, pods, and services as separate NOC dashboards. Click on a NOC box to go to that particular resource's Summary page.
- Identify issues faster by seeing the number of problematic nodes and pods according to their status: DOWN, CRITICAL, TROUBLE, MAINTENANCE.
- Analyze the top CPU and memory intensive nodes and pods to instantly troubleshoot performance issues and avoid future performance degradation.

Inventory Dashboard
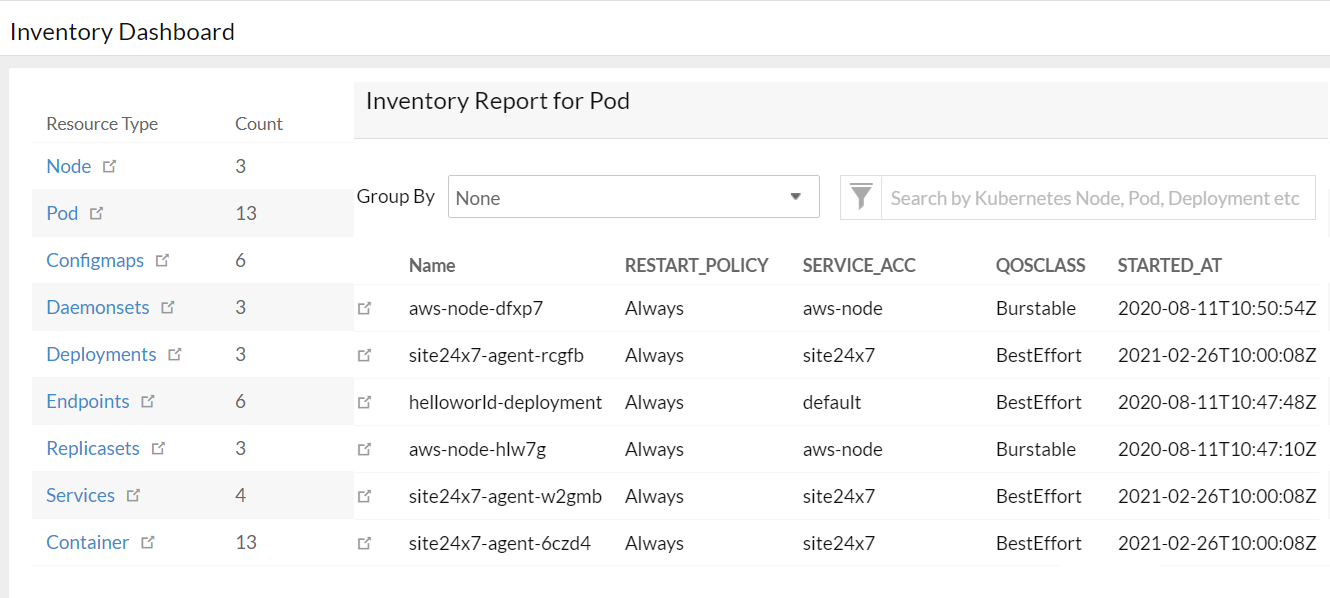
Go to Server > Kubernetes > click on the cluster > Inventory Dashboard. The Inventory dashboard gives you a list view of the various resources in your Kubernetes infrastructure including the count of the nodes, pods, DaemonSets, deployments, endpoints, ReplicaSets, and services. Click on a resource type to view a detailed inventory report including their respective labels, annotations, OS type, and more.

Business View
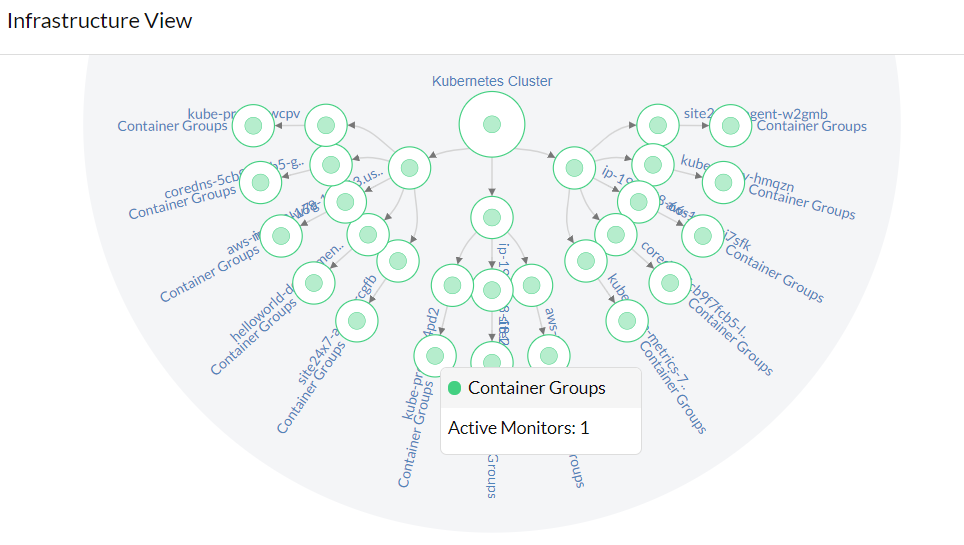
Once a Kubernetes monitor is added, a business view is created for your entire cluster. Toggle between Infrastructure View and Service View to spot outliers and detect unusual monitoring patterns in Kubernetes cluster. Learn more.
Infrastructure View:
This view shows your entire Kubernetes cluster from a node point of view - from the Kubernetes cluster, nodes, pods, and containers.

Service View:
This view shows your entire Kubernetes cluster from a service point of view - from the Kubernetes cluster, service, pods, and containers.
Performance Metrics
For every component discovered and monitored in Site24x7, find below the various performance metrics we provide to ensure continued functioning of the Kubernetes cluster.
Performance Metrics for Services
Go to Server > Kubernetes > click on the cluster > Services > click on the monitor to view performance metrics.
| Metric Name | Description |
| Summary | |
| Configuration Details | Gives the name, type, annotations, IDs, labels, and IP addresses of the load balancer and cluster. |
| Inventory Details | |
| Associated Components | Lists the other components associated with this service like deployments, nodes, and pods. Click on a resource type to view a detailed inventory report. |
Performance Metrics for Nodes
Go to Server > Kubernetes > click on the cluster > Nodes > click on the monitor to view performance metrics.
| Metric Name | Description |
| Summary | |
| Configuration Details | Gives the name, created time, unique ID, labels, annotations, and more |
| Identifiers | Lists labels and annotations associated with the node |
| Conditions | Lists the various conditions for nodes functioning. Thresholds can be set for each of these conditions |
| Resources | Gives the capacity and usage of resources of this node |
| Dependencies | Lists the details of the pods in this particular node |
| Performance | |
| Resource Utilization on CPU Cores | The total CPU resources of the node |
| Resource Utilization on Memory Bytes | The total memory resources of the node |
| Unscheduled Nodes | Whether a node can schedule new pods |
Performance Metrics for Pods
Go to Server > Kubernetes > click on the cluster > Pods > click on the monitor to view performance metrics.
| Metric Name | Description |
| Summary | |
| Configuration Details | Gives the name, host IP, DNS policy, labels, and more. |
| Conditions | Lists the various conditions for pods functioning. Thresholds can be set for each of these conditions. |
| Performance | |
| Pod Status | Status of pods in a given phase |
| Pod Status Ready | Tells whether the pod is ready to serve requests |
| Pod Status Scheduled | Status of the scheduling process for the pod |
Performance Metrics for Containers
Go to Server > Kubernetes > click on the cluster > Containers > click on the monitor to view performance metrics.
| Metric Name | Description |
| Port Bindings | Details of all the ports exposed by the container and their mappings with the host |
| Volume Bindings | Details of all the volumes attached to the container |
| CPU Utilization | CPU utilization for that container in the pod specification |
| Network Stats | Total number of bytes received and transmitted by the container interfaces |
| I/O Utilization | Number of I/Os read, written, completed to/from the disk by the container |
| Anonymous Memory Statistics | The amount of anonymous memory that has been identified as active and inactive by the kernel respectively |
| File Statistics | Cache memory that has been identified as active and inactive by the kernel respectively |
| Cache Size | The amount of memory used by the processes of this control group. |
| Page Statistics | Each time a page is "charged" (added to the accounting) to a Cgroup, PgPin increases. When a page is “uncharged” (no longer “billed” to a Cgroup), PgOut increases |
| Resident Set Size | Non-cache memory for a process |
| Total Memory | The amount of container memory that doesn't correspond to anything on disk: stacks, heaps and anonymous memory maps. |
| Swap Memory | The excess memory requirements to disk when the container has exhausted all the RAM that is available to it. |
| Unevictable Memory | The amount of memory that cannot be reclaimed. Generally, this accounts for the memory that has been locked with mlock. It is often used by crypto frameworks to make sure that secret keys and other sensitive material never gets swapped out to disk. |
Performance Metrics for Deployments
Go to Server > Kubernetes > click on the cluster > Deployments > click on the monitor to view performance metrics.
| Metric Name | Description |
| Configuration Details | Gives the name, created time, unique ID, labels, annotations, and more. |
| Status of ReplicaSets | The status of replicas per ReplicaSet |
| Current Number of Pods | The current number of pod resources in the node |
| Status of Available and Unavailable Pods | The pod resources of a node that are available and not available for scheduling |
| Desired Number of Pods | The minimum desired number of healthy pods |
| Status of Paused Deployments | Tells whether a deployment is paused or not |
| Max Unavailable Replicas during a Rolling Update | Maximum number of unavailable replicas during a rolling update |
Performance Metrics for ReplicaSets
Go to Server > Kubernetes > click on the cluster > ReplicaSets > click on the monitor to view performance metrics.
| Metric Name | Description |
| Configuration Details | Gives the name, created time, unique ID, labels, annotations, and more. |
| Total Replicas | The total number of replicas per deployment |
| Fully Labeled Replicas | The number of fully labeled replicas per ReplicaSet |
| Ready Replicas | The number of replicas ready per ReplicaSet |
| Desired Pods on ReplicaSets | The number of desired pods for a ReplicaSet |
Performance Metrics for DaemonSets
Go to Server > Kubernetes > click on the cluster > DaemonSets > click on the monitor to view performance metrics.
| Metric Name | Description |
| Configuration Details | Gives the name, created time, unique ID, labels, annotations, and more. |
| Available Count of DaemonSets | The number of available daemonsets per deployment |
| Currently Scheduled DaemonSets | The number of nodes that are currently running atleast one daemon pod |
| DaemonSets Ready to be Deployed | The number of nodes that is running the daemon pod and have one or more running and ready |
| Updated DaemonSets | The nodes that run the updated daemon pod spec |
Performance Metrics for Endpoints
Go to Server > Kubernetes > click on the cluster > Endpoints > click on the monitor to view performance metrics.
| Metric Name | Description |
| Configuration Details | Gives the name of the endpoint and namespace, unique ID, and created time. |
| Endpoints Created | Network endpoints created within a Kubernetes cluster |
| Available Addresses | The number of IP addresses available in endpoint |
| Address Not Ready | The number of IP addresses not ready in endpoint |
Performance Metrics for Horizontal Pod Autoscaler (HPA)
Go to Server > Kubernetes > click on the cluster > HPA > click on the monitor to view performance metrics.
| Metric Name | Description |
| Configuration Details | Gives the name of HPA and namespace, unique ID, kind of scaleset, and created time. |
| Current Replicas | Current number of replicas of pods managed by this autoscaler |
| Current vs Target CPU Utilization | Current and target average CPU utilization over all pods, represented as a percentage of requested CPU. For example, 70 means that an average pod is using 70% of its requested CPU. |
| Current and Desired Replicas | Current and desired number of replicas of pods managed by this autoscaler |
| Status Condition | The condition of this autoscaler |
Performance Metrics for StatefulSets
Go to Server > Kubernetes > click on the cluster > StatefulSet > click on the monitor to view performance metrics.
| Metric Name | Description |
| StatefulSet Details | Gives the name of the StatefulSet, namespace, the created time, and unique ID. |
| Config Details | Gives the current and updated revision, service name, pod management policy, update strategy, and more. |
| StatefulSet Status Replicas | The total number of replicas created by the StatefulSet. |
| StatefulSet Current Replicas | The total number of replicas created by the current version of the StatefulSet. |
| StatefulSet Ready Replicas | The number of ready replicas created by this StatefulSet. |
| StatefulSet Updated Replicas | The number of replicas updated to the new version of this StatefulSet. |
| Replicas | The desired number of replicas per StatefulSet. |
| Collision Count | The count of hash collisions for this StatefulSet. |
Performance Metrics for Persistent Volume Claim
Go to Server > Kubernetes > click on the cluster > Persistent Volume Claim (PVC) > click on the monitor to view performance metrics.
| Metric Name | Description |
| Persistent Volume Claim Details | Gives the name of the PVC name, namespace, the created time, and unique ID. |
| Config Details | Gives the volume name, mode, storage class, finalizers, and more. |
| Persistent Volume Claim Status Phase | Gives the current information/status of a PVC. |
Security
The Site24x7 agent collects the configuration data and basic performance data using the Kubernetes API. The API version used is apps/v1. The Site24x7 agent accesses the APIs using RBAC authorization. As a part for RBAC authorization, the following objects with the below mentioned permissions are created while applying the site24x7-agent.yaml file:
- ServiceAccount named 'site24x7' under 'default' namespace.
- ClusterRole named 'site24x7' which includes only 'list' & 'watch' permissions to the APIs for nodes, pods etc.
- ClusterRoleBinding named 'site24x7'.
Once the site24x7-agent.yaml file is applied, the RBAC authorization token is created and automatically mounted into the Site24x7 agent containers created via Daemonset. Using this token, the agent hits the APIs to collect data.
DaemonSet Configurations for the Site24x7 agent:
Once the site24x7-agent.yaml file is applied, a DaemonSet named site24x7-agent is created. RollingUpdate strategy is used for DaemonSet.
- Pods are created with the same name site24x7-agent.
- The containers with 'store/site24x7/docker-agent:<version>' image are created.
Note: ImagePullPolicy is set to 'Always'. - These volumes are mounted inside the containers: /etc/, /var/, /proc/, and /var/run/docker.sock
Collection of performance metrics:
kube-state-metrics is used to collect in-depth performance data. This is enabled only when kube-state-metrics.yaml file is applied. Performance data will be collected by hitting the API:
<KUBE_STATE_IP> -> kube state pod ip
<KUBE_STATE_PORT> -> 8080 by default
Access for Site24x7 agent:
The Site24x7 agent will have only List or Watch permissions for the Kubernetes APIs, as specified in the site24x7-agent.yaml file. The agent can only read Kubernetes objects data via the Kubernetes APIs and no write operations can be performed. The agent cannot create or update any Kubernetes objects. Data is collected by the agent only via authorized methods recommended by Kubernetes.
Reports
In the Site24x7 web client, go to Reports > Kubernetes. The following reports are available for Kubernetes monitor:
- Summary Report
- Availability Summary Report
- Busy Hours Report
- Health Trend Report
- Performance Report
Container Logs
Collect and monitor container logs in the Kubernetes environment via the AppLogs agent running on your Linux servers.
Edit Monitor
You can choose to modify configurations for your Kubernetes cluster in the Edit Kubernetes Monitor page.
- In the Site24x7 web client, go to Server > Kubernetes > click on a cluster > Cluster Details.
- Hover on the hamburger icon beside the display name. Click on Edit.
- Choose to edit the Display Name, association with Monitor Groups, Tags, IT Automation Templates, Exclude/include Namespaces, Exclude/include Names, Exclude/include Labels, select/deselect Resource Groups, and edit Configuration Profiles.
- Under Resource Termination Settings, mute alerts when resources are terminated using the Mute Resource Termination Alerts option and remove terminated resources using the Automatically Remove Terminated Resources toggle. You can also specify how long (in days) the terminated resources should be retained in the Site24x7 web console before permanent deletion.
- Save your changes.
Licensing
The main Kubernetes cluster is a basic monitor. For more information, read this article.
FAQs
- Possible reasons why Kubernetes monitor is not added to Site24x7
- How to verify if the Site24x7 pods are created or are in running state?
- How to disable auto discovery of containers for Kubernetes clusters?
- How to access agent pod and share logs for troubleshooting?
- What will happen if I have an agent installed in a node and try to install the agent again as a pod?
- Will Kubernetes be discovered using the Discover Applications option?
- Is the path 'store/site24x7/docker-agent:<version>' used to create site24x7-agent a local registry or a public registry?